USDCAD and USDCNH: USDCAD is moving to a new monthly high
- This week, we see a continuation of the bullish trend in USDCAD.
- During this morning’s Asian trading session, USDCNH encountered resistance at 7.29736.
USDCAD chart analysis
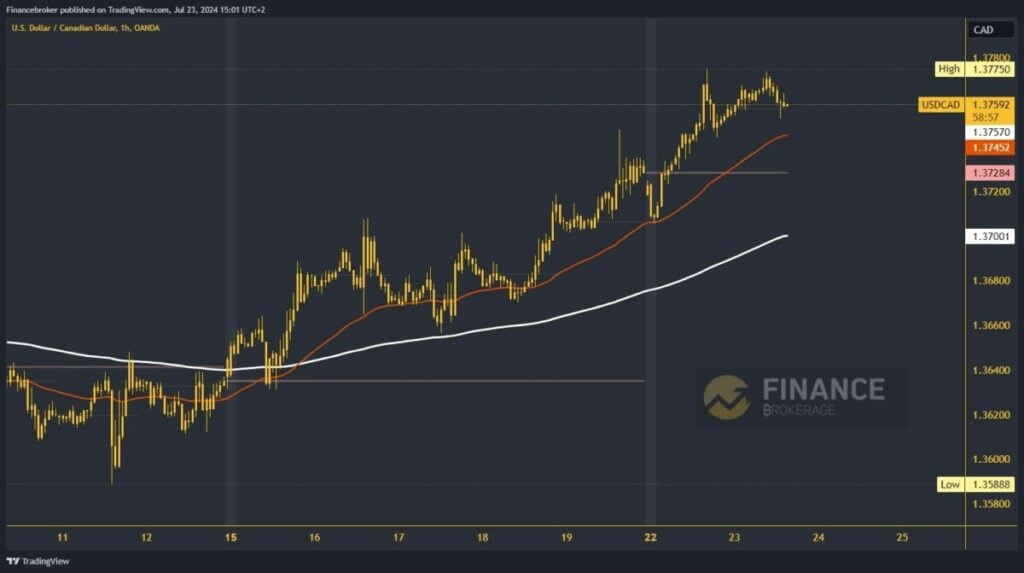
This week, we see a continuation of the bullish trend in USDCAD. On Monday, a new high was formed at the 1.37750 level. During this morning’s Asian trading session, we had another bullish attempt which was stopped at the 1.37745 level. The pair remains stable above the daily open price but is under slight bearish pressure. That could lead us to see a pullback to the 1.37500 level and test the EMA 50 moving average there.
If this support is not sufficient, the USDCAD will be forced to look for new, lower support. Potential lower targets are the 1.37400 and 1.37200 levels. For a bullish option, we need a continuation of positive consolidation and a return to the zone of the weekly high. A new visit could spawn an impulse above to a new higher high. Potential higher targets are the 1.37800 and 1.38000 levels.
USDCNH chart analysis
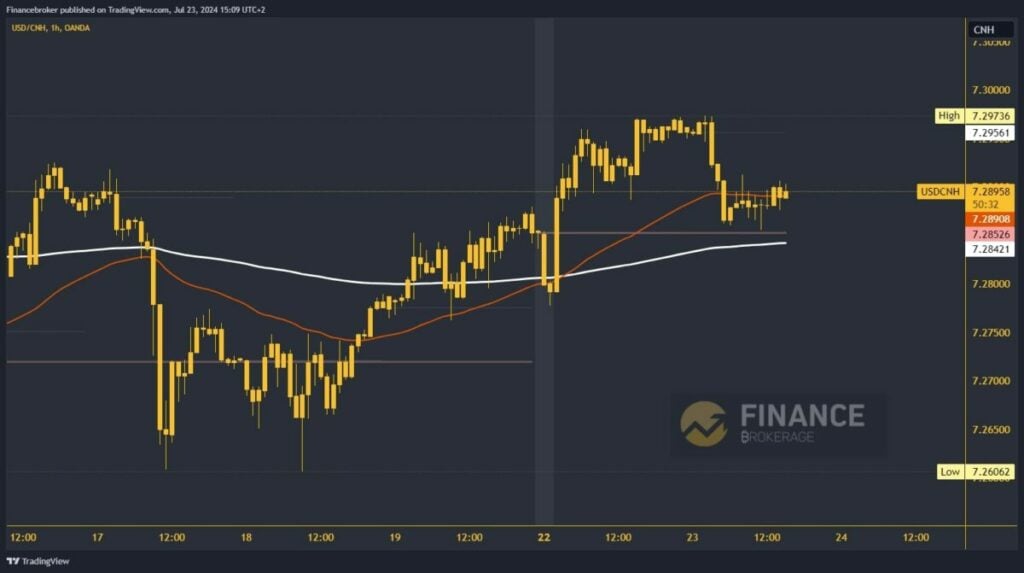
During this morning’s Asian trading session, USDCNH encountered resistance at 7.29736. After that, we saw the initiation of a bearish consolidation and a drop to the 7.28600 level. The pair managed to stabilize and initiate a recovery to the 7.29000 level. USDCNH is trying to get back above the EMA 50 moving average and get its support. If we succeed, the pair will have an opportunity to strengthen the bullish momentum and continue on the bullish side.
Potential higher targets are the 7.29500 and 7.30000 levels. For a bearish option, we need to see USDCNH fall below the 7.28500 level. With that step, we move below the weekly open price and test the EMA 200 moving average. A stronger bearish momentum could quickly push the pair to a new daily low and thus strengthen the bearish scenario. Potential lower targets are the 7.28000 and 7.27500 levels.
The post USDCAD and USDCNH: USDCAD is moving to a new monthly high appeared first on FinanceBrokerage.


