S&P 500 and Nasdaq in retreat to new weekly lows
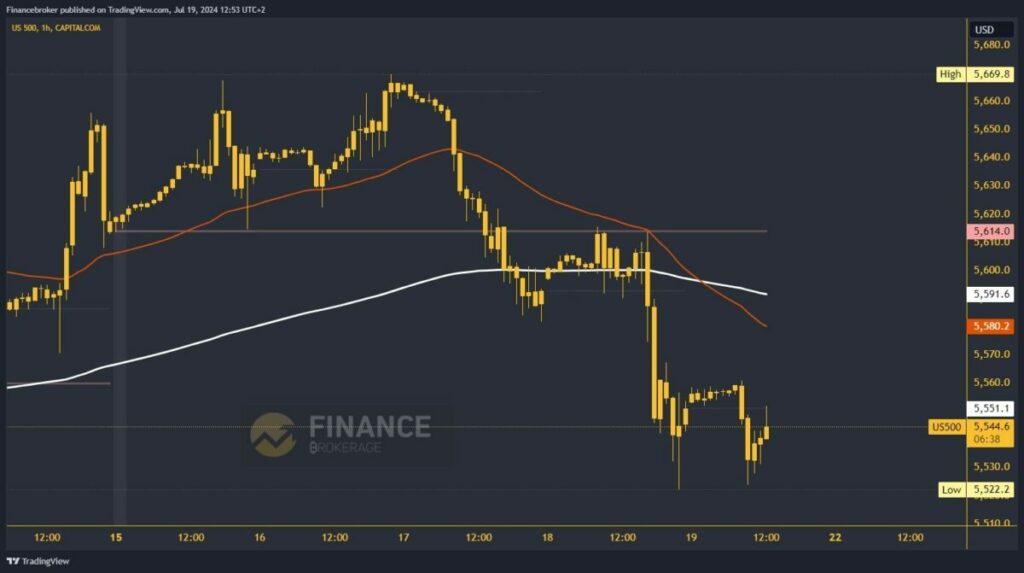
- On Tuesday, the S&P 500 index formed a new all-time high at 5669.8.
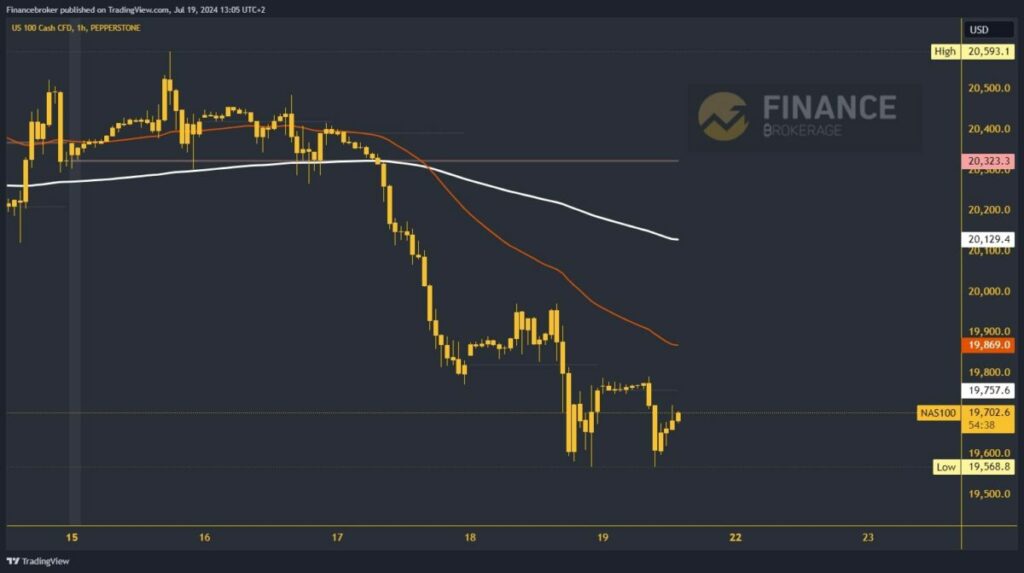
- The value of the Nasdaq index fell to 19568.8 last night, forming a weekly low there.
S&P 500 chart analysis
On Tuesday, the S&P 500 index formed a new all-time high at 5669.8. After its formation, the index lost momentum and turned bearish. On Wednesday, we fell below 5600.0, and on Thursday, a weekly low was formed at the 5522.2 level. During this morning’s Asian session, we first saw a bullish attempt that was stopped at the 5560.0 level. This led to another pullback and a test of the weekly low.
For now, we are holding above but remain under pressure in this support zone. Potential lower targets are the 5510.0 and 5500.0 levels. For a bullish option, we need a positive consolidation and a jump above the 5560.0 level. With that, we climb to a new daily high and move to the bullish side. After that, we can expect to see some recovery in the S&P 500 index.

Nasdaq chart analysis
The value of the Nasdaq index fell to 19568.8 last night, forming a weekly low there. During this morning’s Asian trading session, we tested that level once again. We have received new support, and now we need to see a bullish impulse above the 19800.0 level. Then we need to stabilize there. After that, the Nasdaq would have a better position from which it could continue to grow to the bullish side.
With the jump to 19900.0, we get the EMA 50 moving average support. Potential higher targets are 20000.0 and 20100.0 levels. We need a negative consolidation and pullback to the weekly support level for a bearish option. That would be the third time in 24 hours that we are at that level. This time, we could easily see the impulse below and a new lower low formation. Potential lower targets are 19500.0 and 19400.0 levels.

The post S&P 500 and Nasdaq in retreat to new weekly lows appeared first on FinanceBrokerage.


