Solana Price Analysis: Resistance at $114.85 Level Today
- The price of Solana fell to $105.69 on Saturday, forming a new low there.
- On Saturday, we saw a pullback in the price of Cardano to the 0.570 level.
Solana chart analysis
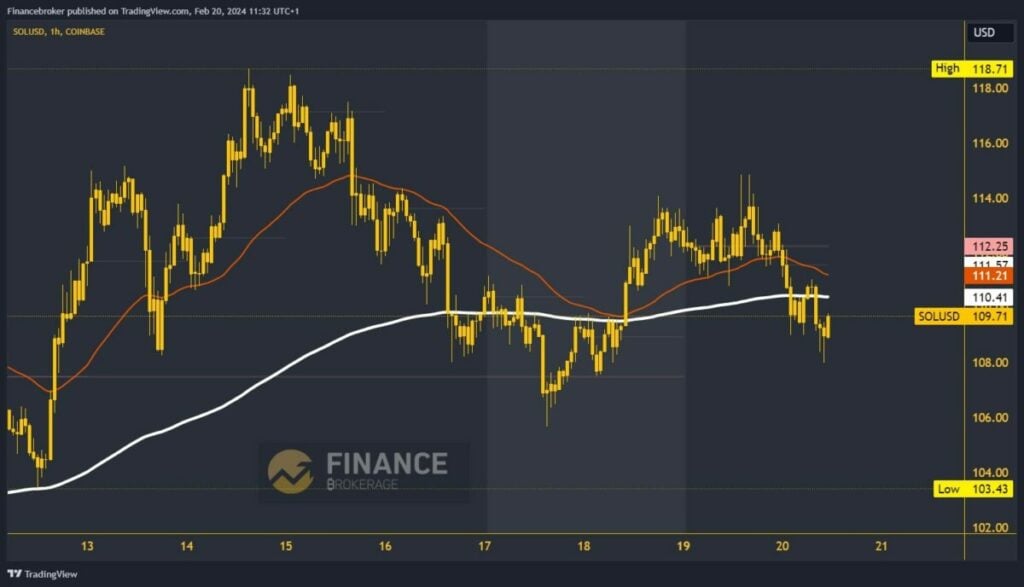
The price of Solana fell to $105.69 on Saturday, forming a new low there. After that, we see successful support and a return above $110.00 on Sunday. Yesterday’s high price was at the $114.85 level, and this is where we encountered this week’s resistance. This was followed by a price pullback from there, and today, we are seeing a continuation and drop to the $108.00 level.
Additional pressure creates a move below the EMA200 moving average. This reinforces the bearish picture for the Solana price. Potential lower targets are $108.00 and $107.00 levels. We need a price return above $111.00 and the EMA200 for a bullish option. By crossing above, we get the support of the moving average, and the price has the opportunity to start a new recovery. Potential higher targets are $112.00 and $113.00 levels.
Cardano chart analysis
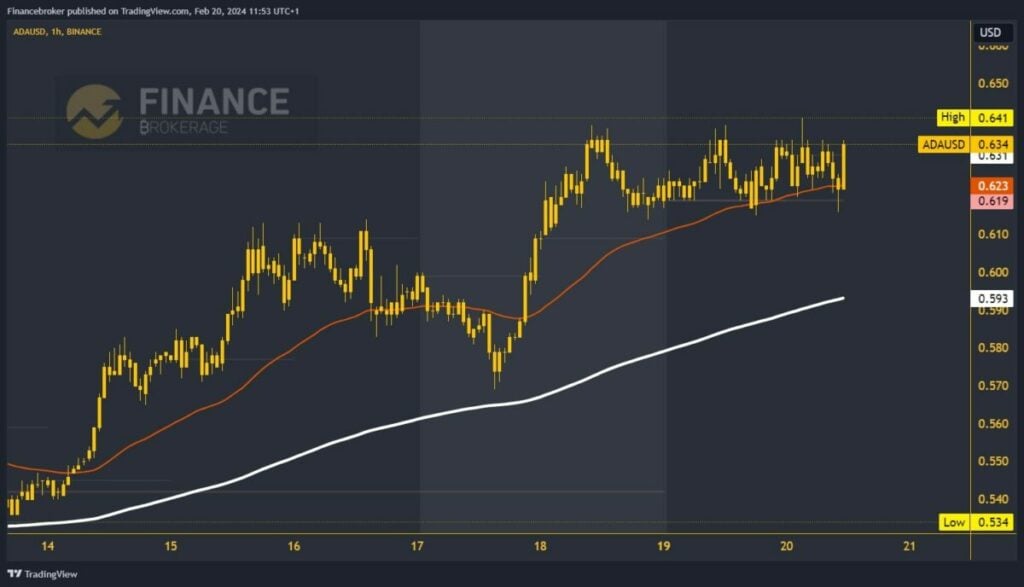
On Saturday, we saw a pullback in the price of Cardano to the 0.570 level. This is where we come across EMA200 and get its support. After that, a bullish consolidation up to the 0.640 level succeeded. This week, the price is moving in the 0.615-0.640 range and is getting closer to breaking above and climbing to a new price high. Potential higher targets are 0.650 and 0.660 levels.
We need a negative consolidation and drop prices below the 0.615 level for a bearish option. With that, we would form this week’s new low and get confirmation of the bearish momentum. Cardano would then have to go into retreat and search for new support. Potential lower targets are 0.610 and 0.600 levels. Additional price support in the zone around 0.600 is the EMA200 moving average.
The post Solana Price Analysis: Resistance at $114.85 Level Today appeared first on FinanceBrokerage.

