


There is no denying that Tesla has been a big-time outlier out of the Magnificent 7 stocks. While names like META have exploded to double-digit gains just this week, TSLA is down about 38% from its July 2023 high and about 55% off its all-time high in late 2021.
Now, Tesla is approaching a “confluence of support” where multiple technical analysis techniques agree on a particular level or range. Will this be the time when TSLA finally finds its footing? And how can we differentiate a short-term mean reversion bounce from a more sustained recovery?
It’s worth remembering that, in the first half of 2023, Tesla was a serious outperformer, handily outpacing the S&P 500 as it almost tripled in value in just over six months. But after the July 2023 peak, it’s been a fairly consistent stepwise downtrend of lower lows and lower highs.

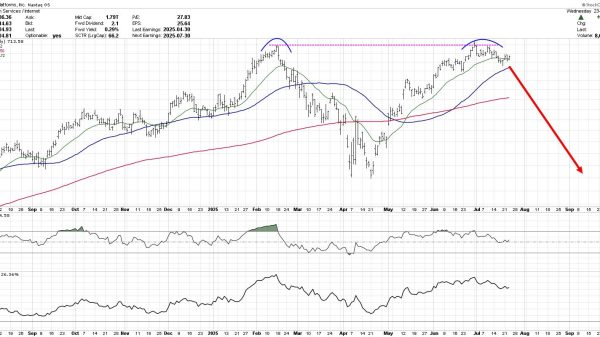
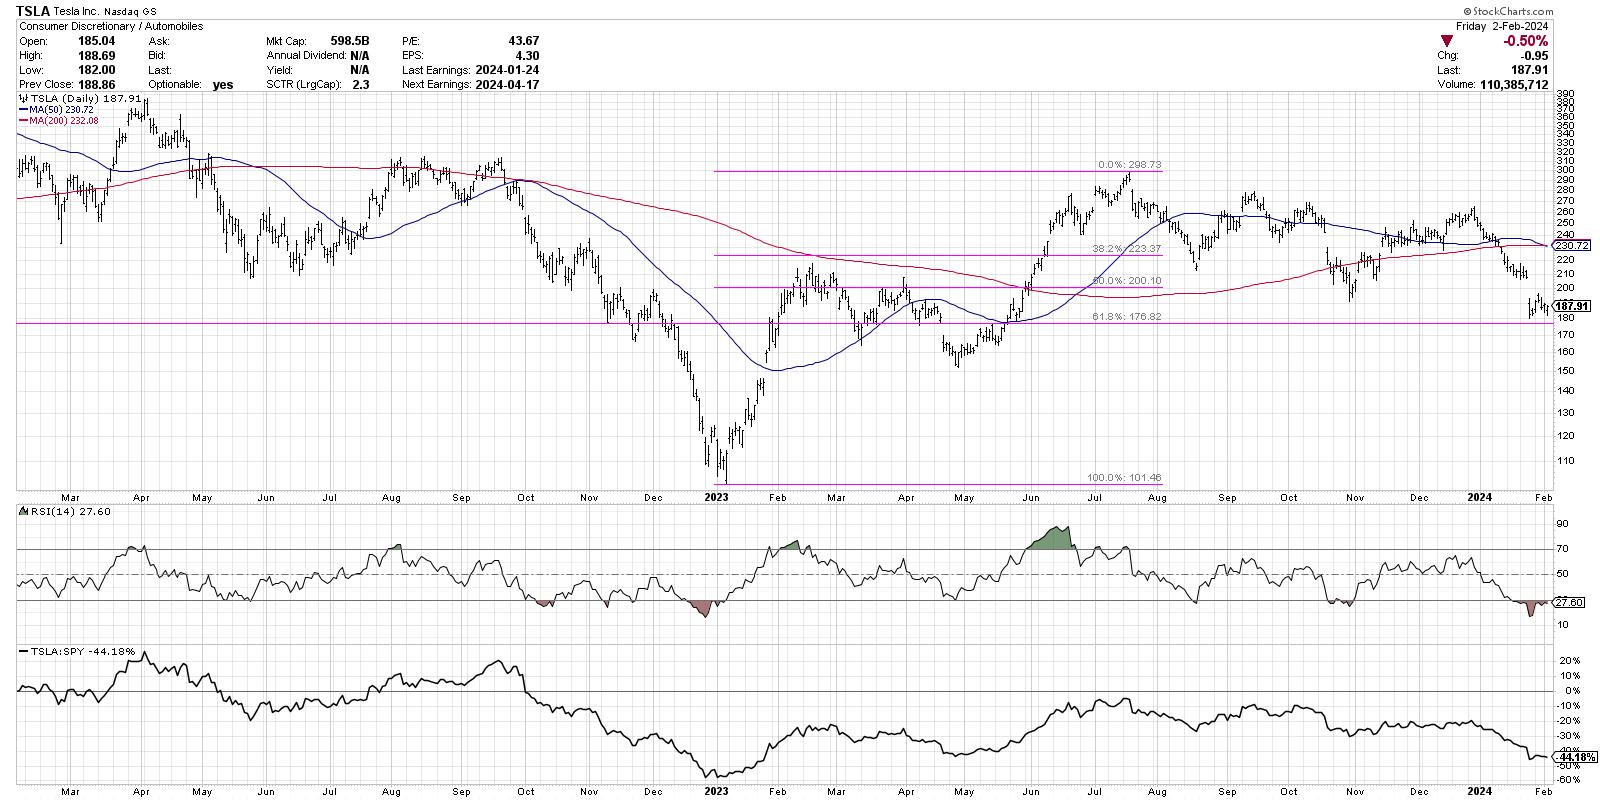
Applying a Fibonacci framework to the last seven months shows a 38.2% retracement around $223, right about where the first swing low occurred in August 2023. The next downswing stalled out around the 50% retracement level at $200, which also pushed just below the 200-day moving average. The most recent downswing, which has basically been the story of early 2024 for Tesla, has pushed the price down to almost the 61.8% retracement level of around $177.
Tesla is currently oversold, with an RSI below 30 for the last couple weeks. Previous swing lows in August and October 2023 also involved an RSI around these levels. Will we see another oversold bounce off Fibonacci support? We think so. But now, let’s combine the price momentum with a gauge of price trend.
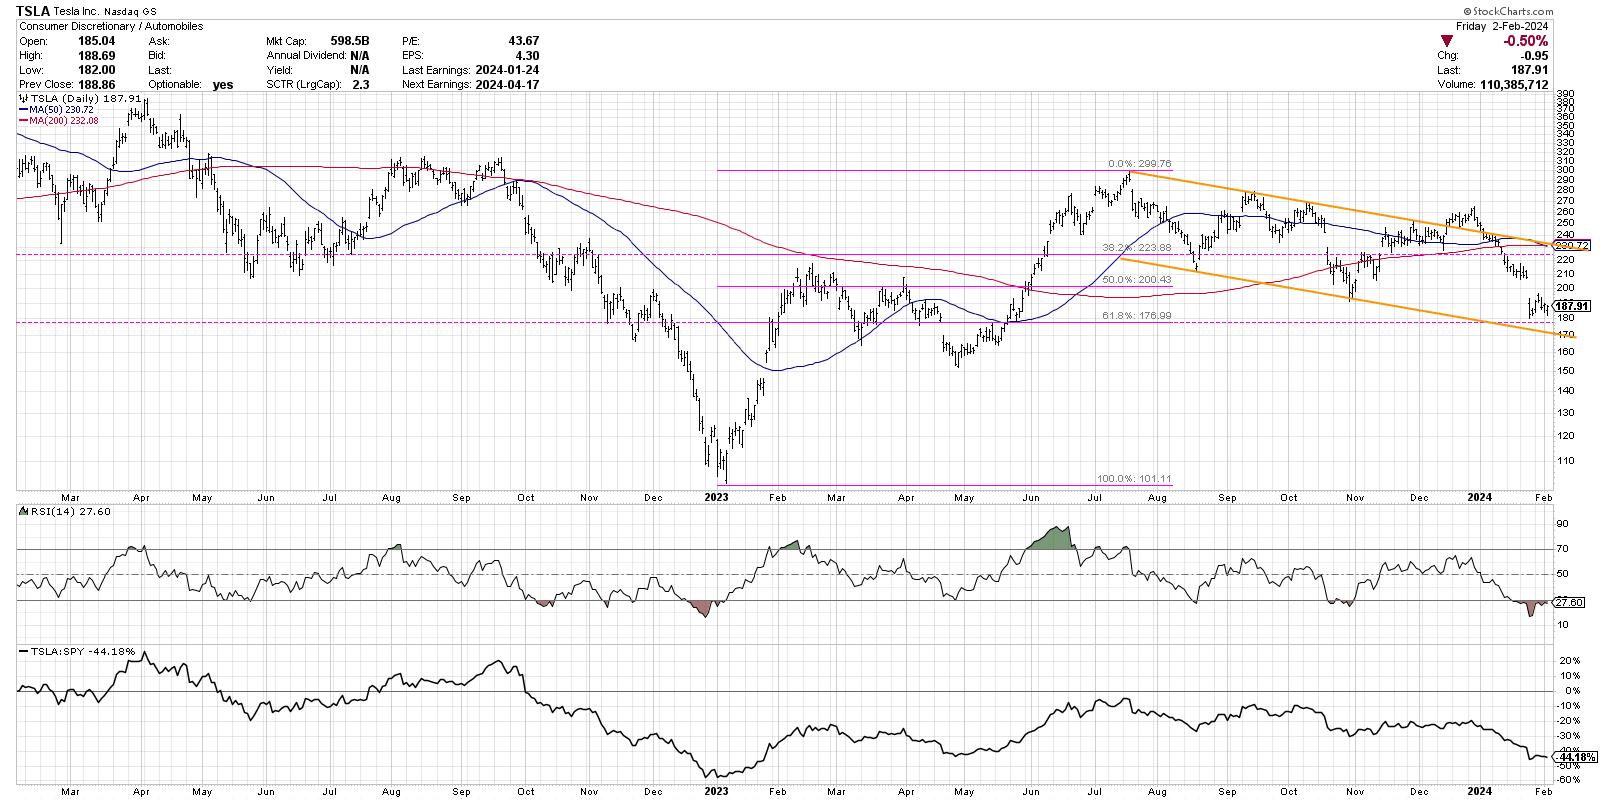
Starting from the July 2023 high, I’ve drawn a trendline connected to the peak two months later in September. That trendline coincides well with subsequent highs in October and November, confirming the validity of this visual trend gauge. Note the failed breakout in late December, which certainly had me speculating that Tesla was beginning to mount a serious recovery. It was not to be, as the price soon returned to the downtrend channel.
See how the price has now pushed back to the lower boundary of this trend channel? Now we have another charting technique confirming potential support around $170, not far from the Fibonacci level of $177. So a stock is oversold as it tests support generated from two different technical approaches!
If we do see a countertrend bounce here, the real question will be whether this is the beginning of a broader advance, potentially leading back to the July 2023 high around $300. But the problem here is we have a confluence of resistance around the $225-230 range. That’s the 38.2% retracement we mentioned earlier, as well as the upper edge of the trend channel. The 50-day and 200-day moving averages are actually right around that same level as well! So, while the current oversold conditions suggest a short-term bounce is imminent, I would need to see a break above that confluence of resistance to consider a retest of the 2023 high as a real possibility.
Mindful investors recognize that investing is not just about finding one indicator, or one approach, and then just sitting back and reaping the rewards of its buy and sell signals. Technical analysis is more about the weight of the evidence, considering the lessons of market history, and recognizing the importance of when multiple techniques line up. For now, the charts suggest Tesla may be ripe for a decent countertrend bounce.
RR#6,
Dave
P.S. Ready to upgrade your investment process? Check out my free behavioral investing course!
David Keller, CMT
Chief Market Strategist
StockCharts.com
Disclaimer: This blog is for educational purposes only and should not be construed as financial advice. The ideas and strategies should never be used without first assessing your own personal and financial situation, or without consulting a financial professional.
The author does not have a position in mentioned securities at the time of publication. Any opinions expressed herein are solely those of the author and do not in any way represent the views or opinions of any other person or entity.