


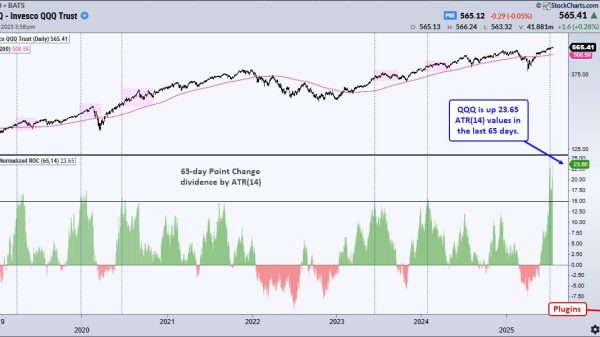


SPY and QQQ crossed above their 200-day SMAs with big moves on Monday, and held above these long-term moving averages the entire week. The V-Reversal was extraordinary and SPY seems short-term overbought, but this cross above the 200 day SMA cross is a bullish signal for the most important market benchmark. Despite a bullish signal, long-term moving averages are trend-following indicators and it is important to set realistic expectations.
***** This is an abbreviated version of a research report covering the 200-day SMA, performance improvements and a twist for QQQ. Recent reports at TrendInvestorPro covered the V-Reversal, the Bottoming Process and an Exit Strategy for the Zweight Breadth Thrust. Click here to take a trial and get immediate access. *****
The chart below shows SPY with the 200-day SMA (blue). This 200-day cross captured two big uptrends since 2020 and foreshadowed the bear market in 2022. Even though these three signals look great, there were plenty of whipsaws along the way. SPY crossed the 200-day SMA 141 times since 2005, which averages 7 crosses per year. Averages can be deceptive because some years have more crosses than others. SPY did not cross its 200-day in 2021 and 2024, but there were 22 crosses between January 2022 and March 2023.
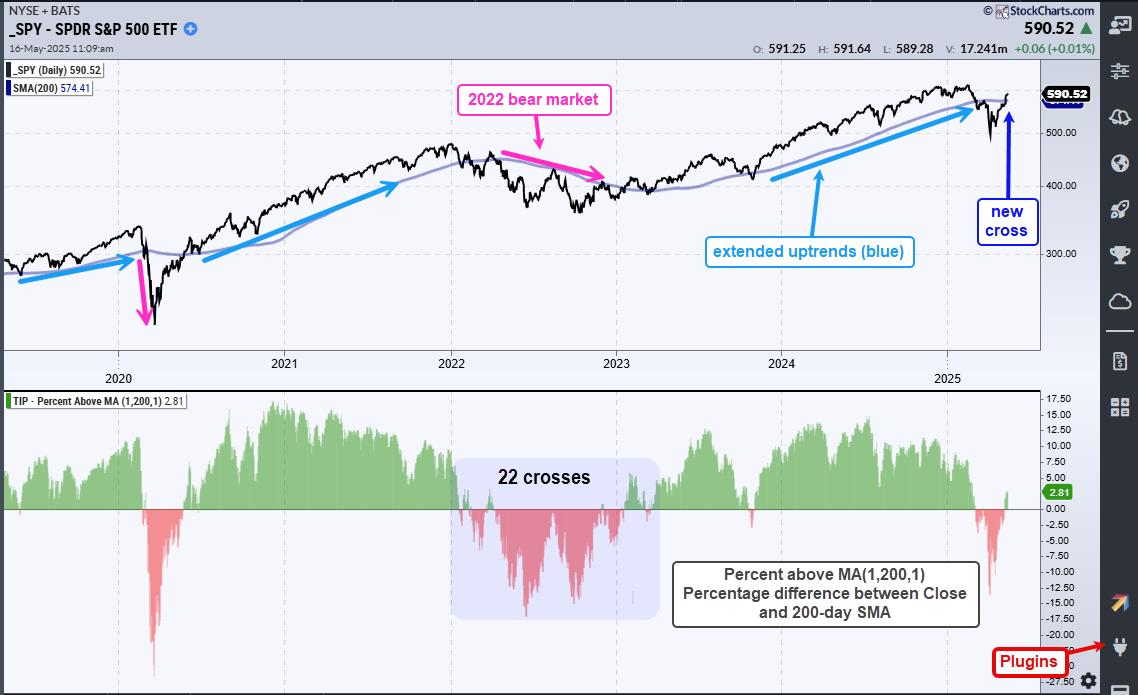
The indicator window shows Percent above MA (1,200,1) to better highlight these crosses. It turns positive (green) with a bullish cross and negative (red) with a bearish cross. The values are the percentage difference between the close and the 200-day SMA.
There is no such thing as a perfect indicator. Trend-following indicators are great at catching big trends, but they are also prone to whipsaws (failed signals). Whipsaws are simply the price of admission for a trend-following strategy. We must take the good (big trends) with the bad (whipsaws). As the chart above confirms, trend-following works over time because one good trend pays for the whipsaws.
Chartists can improve 200-day SMA signals with a little smoothing. For example, use a 5-day SMA instead of the close. Since 2005, the 5-day SMA crossed its 200-day SMA 55 times, which averages out to 3 per year. Fewer signals means fewer whipsaws. Also note that this smoothing generated higher returns and lower drawdowns.
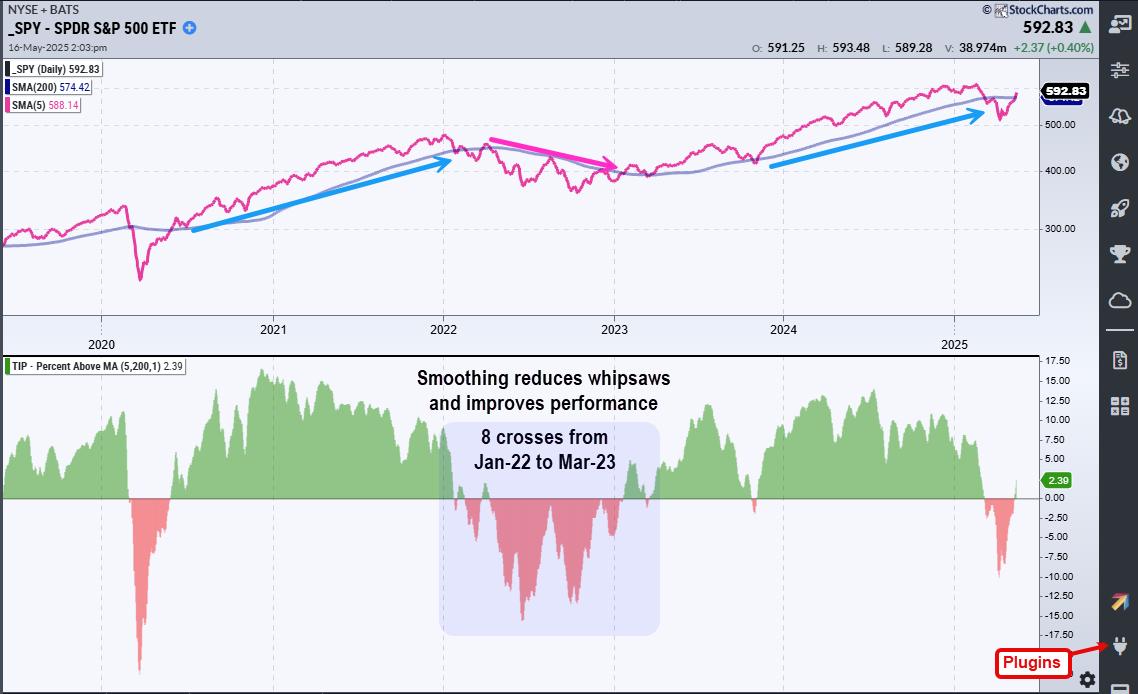
The chart above shows the SPY with Percent above MA (5,200,1). This indicator captures the percentage difference between the 5 and 200 day SMAs. Instead of 22 crosses between January 2022 and March 2023, the 5-day SMA crossed the 200-day SMA just 8 times. This indicator is part of the TIP Indicator Edge Plugin for StockCharts ACP.
We can reduce whipsaws even more by adding a signal filter. This next section will cover signal filters and performance metrics for SPY. We then show how other ETFs perform and add little twist to improve performance for QQQ signals. This section continues for subscribers to TrendInvestorPro. Click here to take a trial and get immediate access.
////////////////////////////////////////