


The US Consumer Confidence Index® came in much lower than expectations, and the Expectations Index fell to 72.9. A fall below 80 signals a recession ahead, enough to elevate the fear of economic weakness. As a result, the stock market sold off. But after 11:30 AM ET, the buyers came in, and the market rebounded from its lows. However, the rebound wasn’t enough to make much of a dent, except for the Dow which closed in the green.
If you regularly monitor breadth indicators, you may have noticed that the New Highs – New Lows Index ($NYHL) was up over 150%. This caught my attention. The broader equity indexes were falling significantly, yet the new highs were way higher than the new lows. That was unusual, but since the stock market is known for pulling surprises when you least expect it to, it’s helpful to look under the hood to determine if the stock market is strong or weak.
The Market’s Heart Beat
Looking through the rest of my charts in my Market Analysis ChartList — a part of my daily routine — one that I found interesting is the SPDR S&P 500 ETF (SPY) with the Percent Above Moving Average oscillators in the lower panels (see chart below).
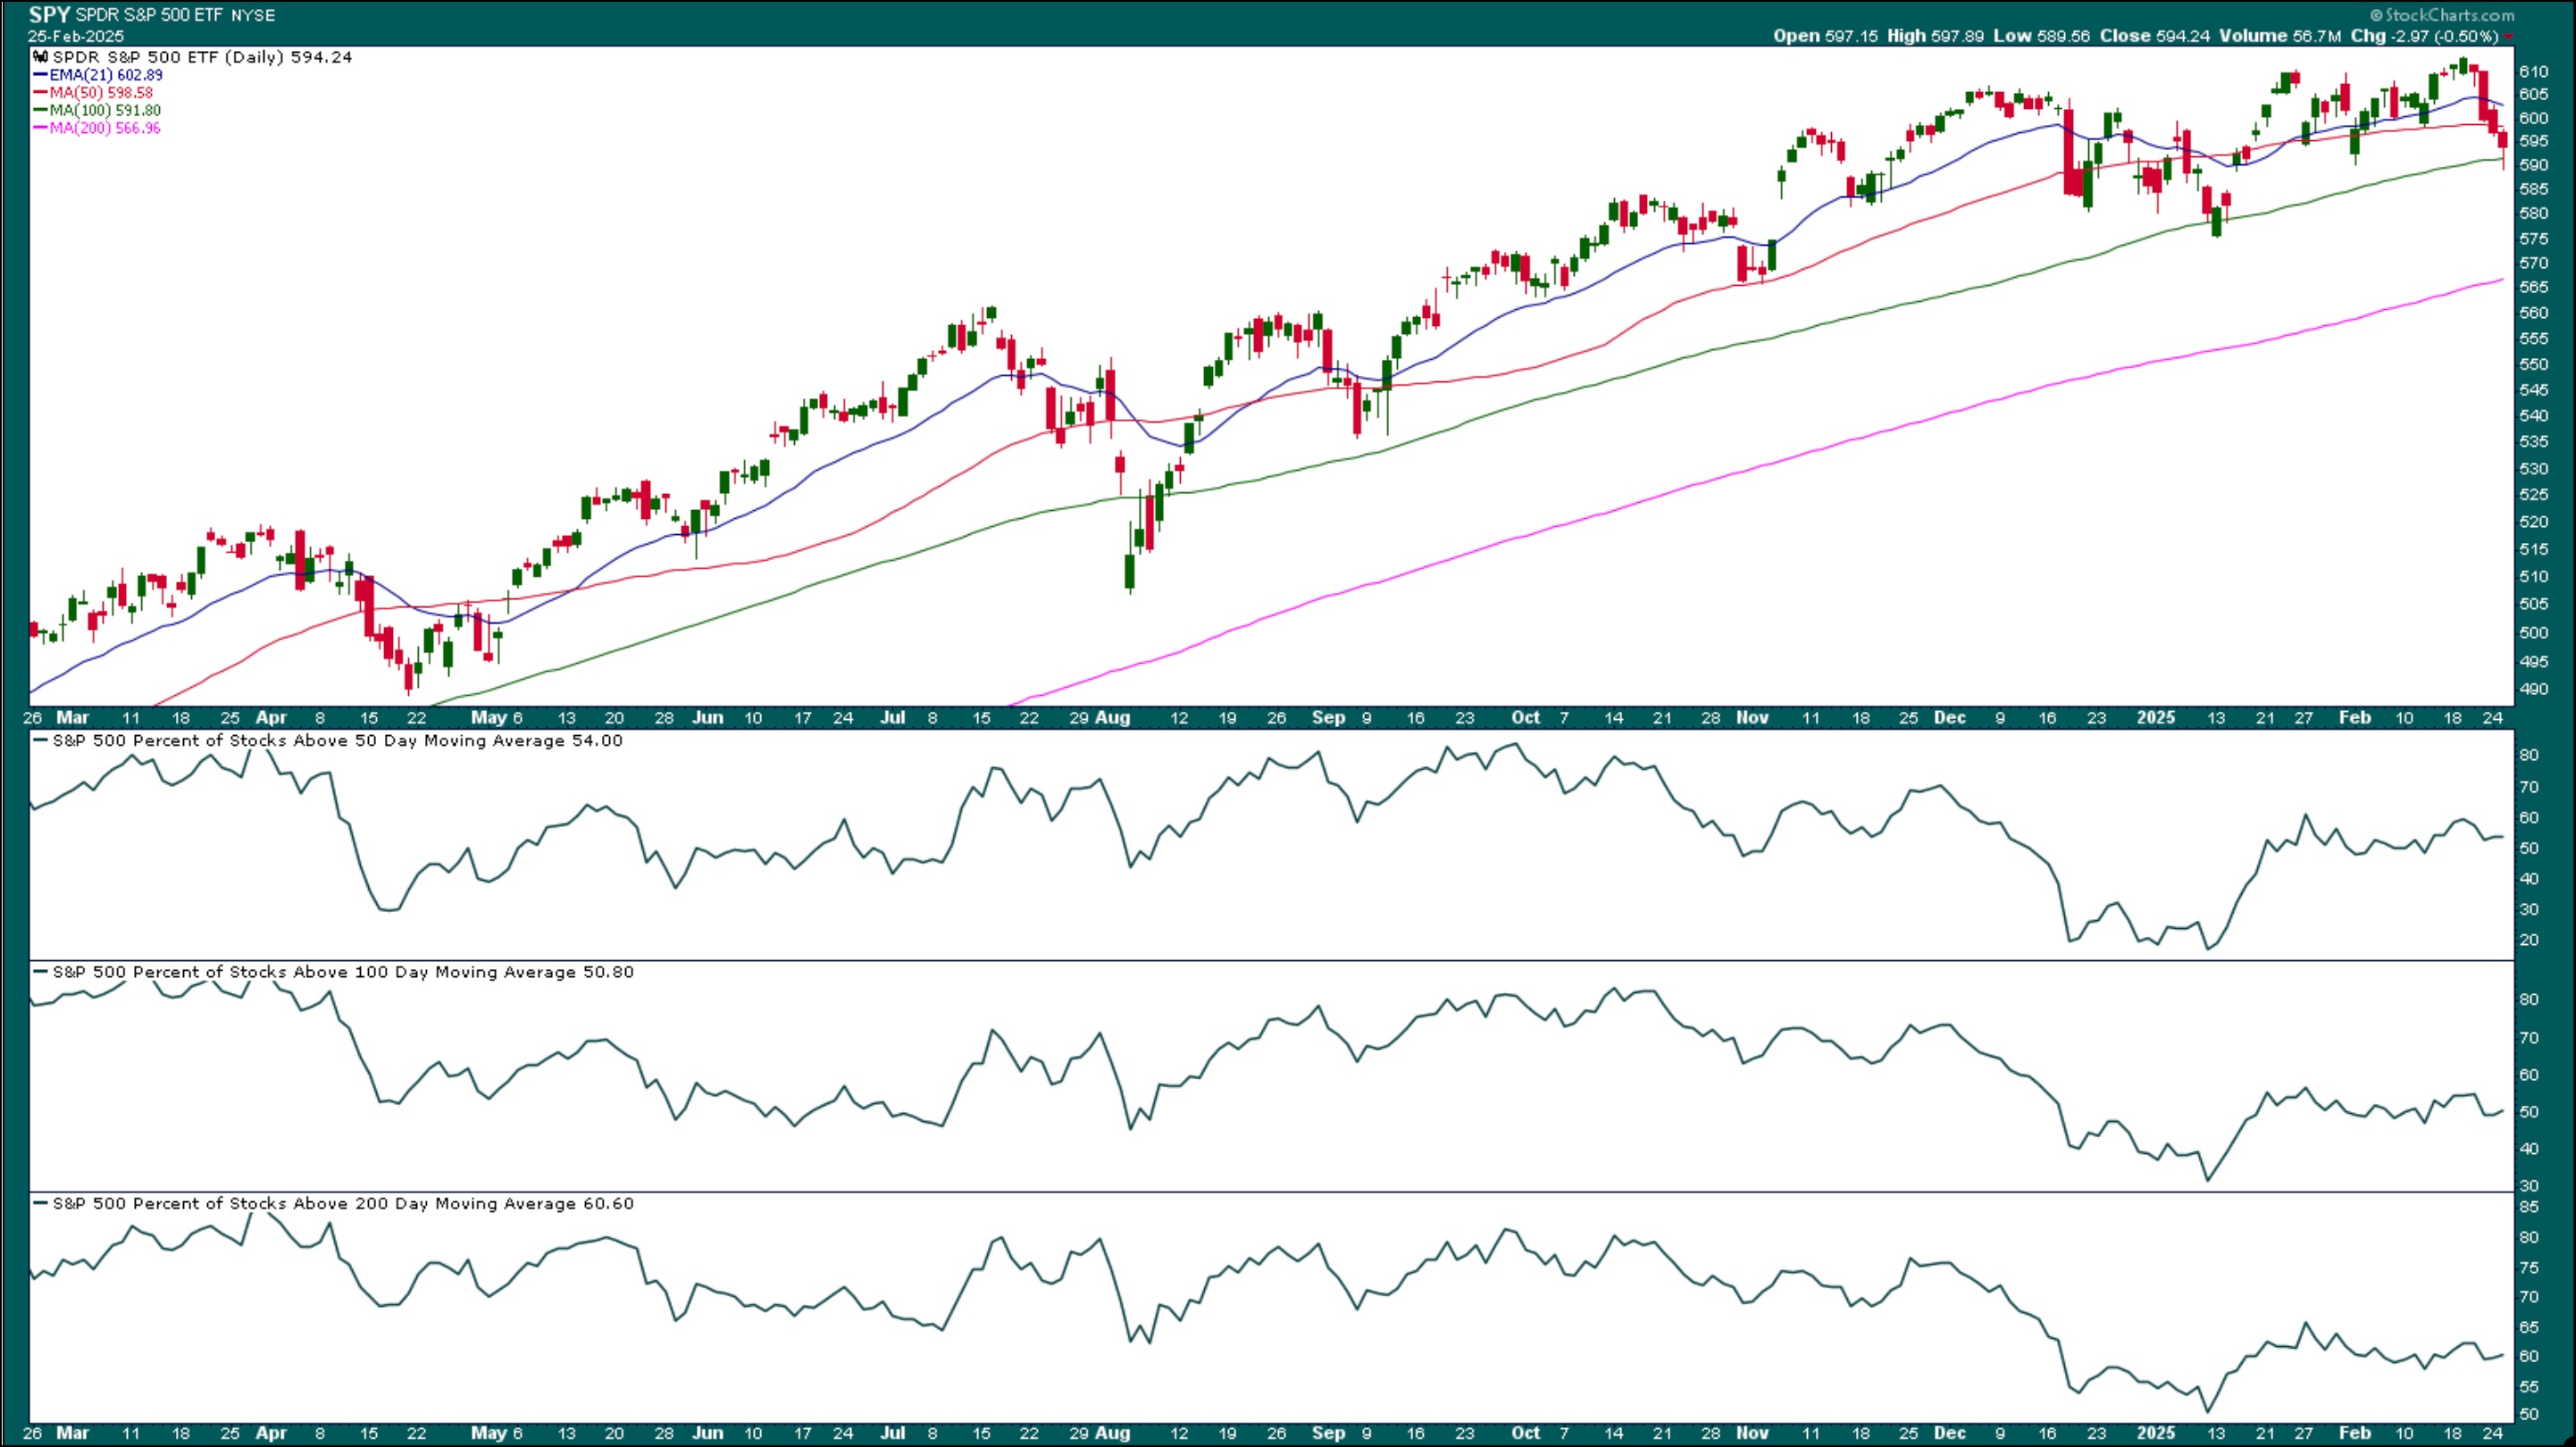
FIGURE 1. DAILY CHART OF SPY. The percentage of S&P 500 stocks trading above their 50-, 100-, and 200-day simple moving averages are above 50 but watch these oscillators closely as they indicate the health of the overall market. Chart source: StockCharts.com. For educational purposes.
It’s interesting to note that the percentage of S&P 500 stocks trading above their 50-, 100-, and 200-day simple moving averages (SMAs) started to decline at the end of September 2024. The SPY was still trending higher and it wasn’t till December when it started to pull back.
The September pullback coincided with a relatively low percentage of stocks trading below their moving averages and declined further during the January 2025 pullback. But the oscillators recovered from these levels and as of now, even though SPY bounced off its 100-day moving average, they are not close to the previous lows. The good thing is they are all above their 50 threshold level. You can’t say the same for the Nasdaq stocks.
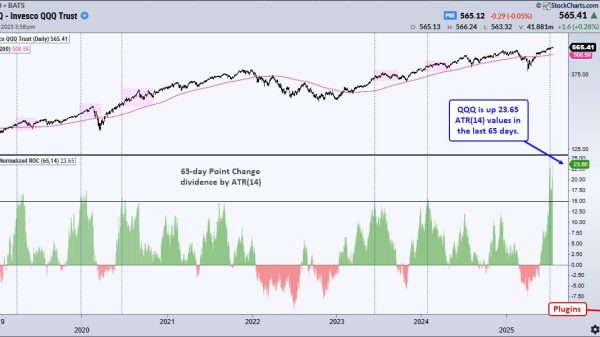
The chart below replaces SPY with Invesco QQQ Trust (QQQ) and analyzes the percentage of Nasdaq stocks trading above the 50-, 100-, and 200-day SMAs. They are trading at levels seen in August 2024, which is when QQQ went through a -15.56% pullback.
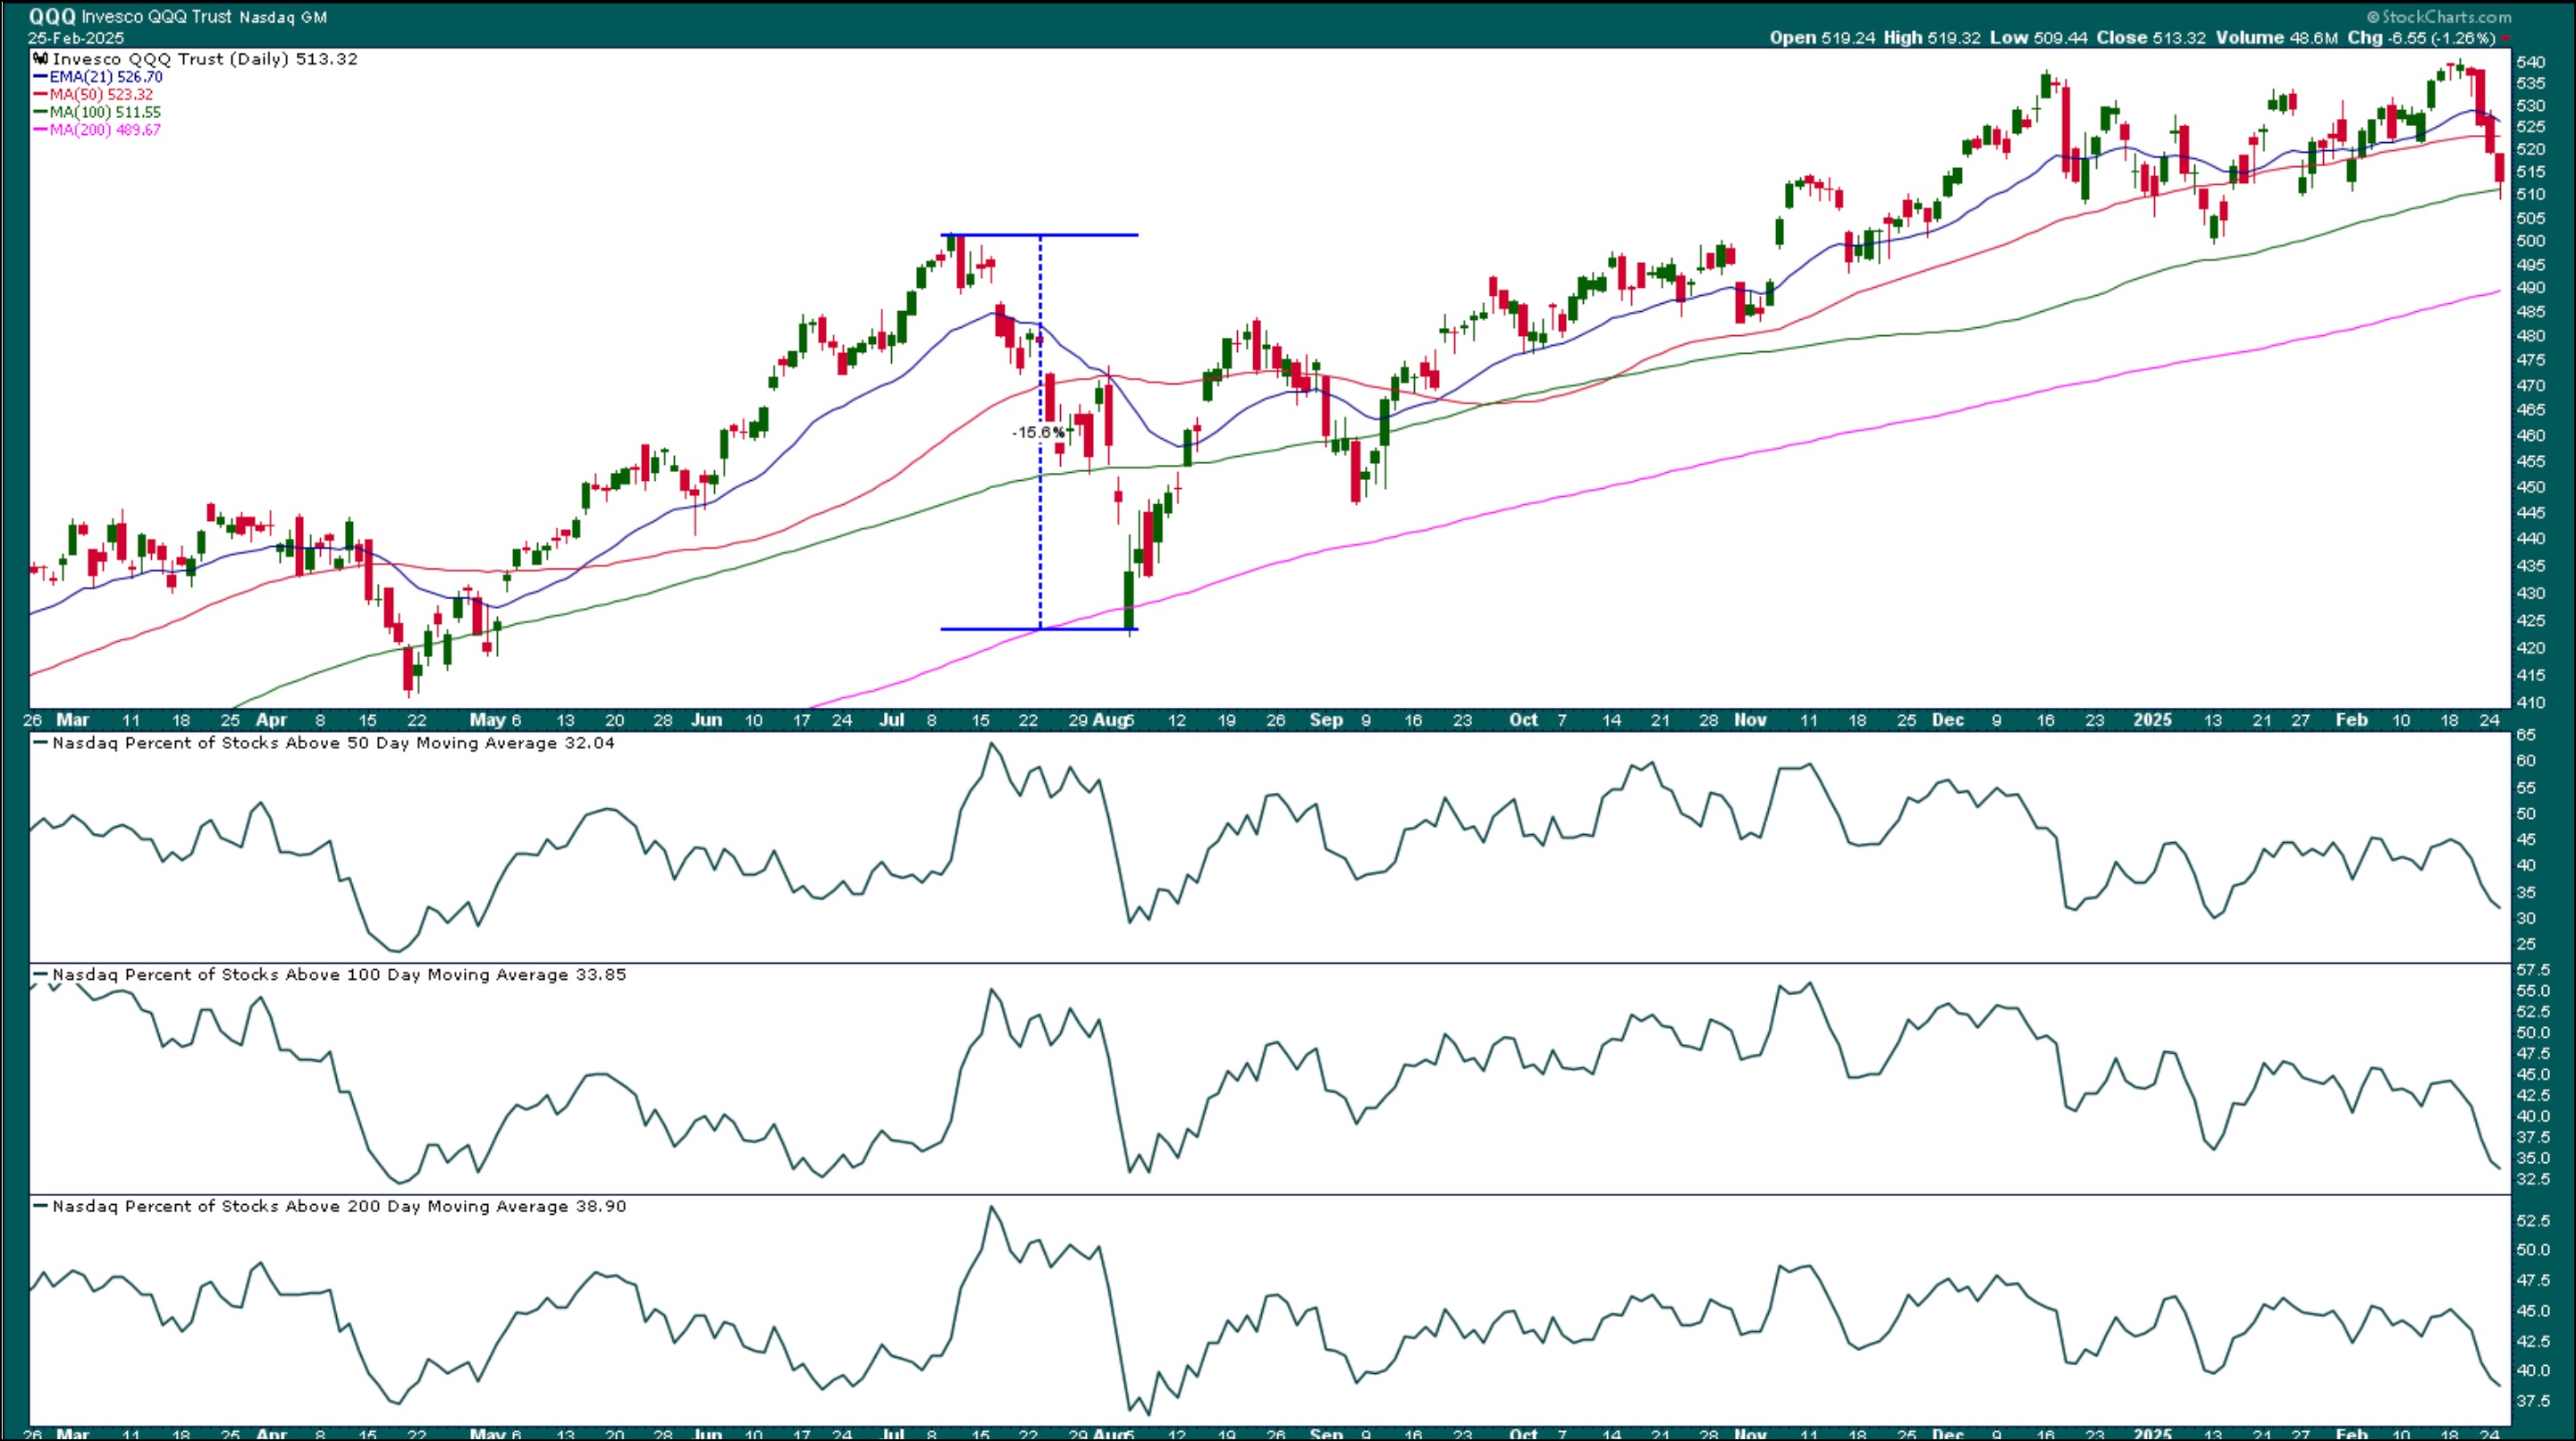
FIGURE 2. DAILY CHART OF QQQ. Although the QQQ is holding on to the support of its 100-day SMA, the percent of stocks trading below their moving averages are below 50, which is a bearish indication. Chart source: StockCharts.com. For educational purposes.
The Technology sector witnessed a four-day losing streak and was the worst-performing sector in the last week. Tech stocks are facing many headwinds — tariffs, AI unwinding, and chip availability, to name a few. Investors are rotating out of Tech stocks and moving into the offensive sectors — Consumer Staples, Real Estate, and Health Care.
The Bottom Line
The broader stock market is at an interesting juncture and could go either way. SPY and QQQ are holding on to the support of their 100-day SMA but two important news events could shake things either way — NVIDIA earnings and Personal Consumption Expenditures Price Index (PCE). The rest of the week could be a bumpy ride.
If you haven’t done so, apply the percentage of stocks trading above significant moving averages oscillator. Percentage Above Moving Average indicator is available for several indexes. Try them out and see which ones give you a good “under the hood” look at the broader market.
StockChart Tip. Click the charts of SPY and QQQ in the article to see a live chart.
Then, save the charts to one of your ChartLists. Not sure how to create ChartLists? Check out this tutorial.

Disclaimer: This blog is for educational purposes only and should not be construed as financial advice. The ideas and strategies should never be used without first assessing your own personal and financial situation, or without consulting a financial professional.