The Russell 2000 ETF managed a double-digit gain in 2024, but did it the hard way with several deep pullbacks. Pullbacks within uptrends are opportunities and we can find such opportunities using %B.
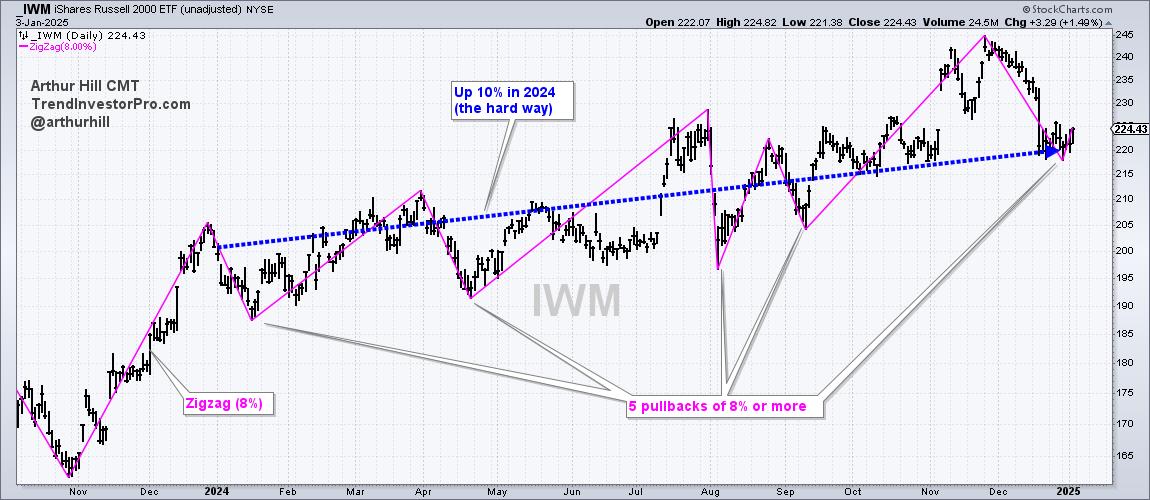
The chart below shows the Russell 2000 ETF (IWM) with the Zigzag(8) indicator. This indicator changes direction when there is a move greater than 8%, which means it ignores price moves that are less than 8%. I am showing this indicator to highlight five pullbacks of 8% or more in 2024. That’s a lot. In contrast, the S&P 500 SPDR (SPY) only experienced one 8+ percent pullback in early August.
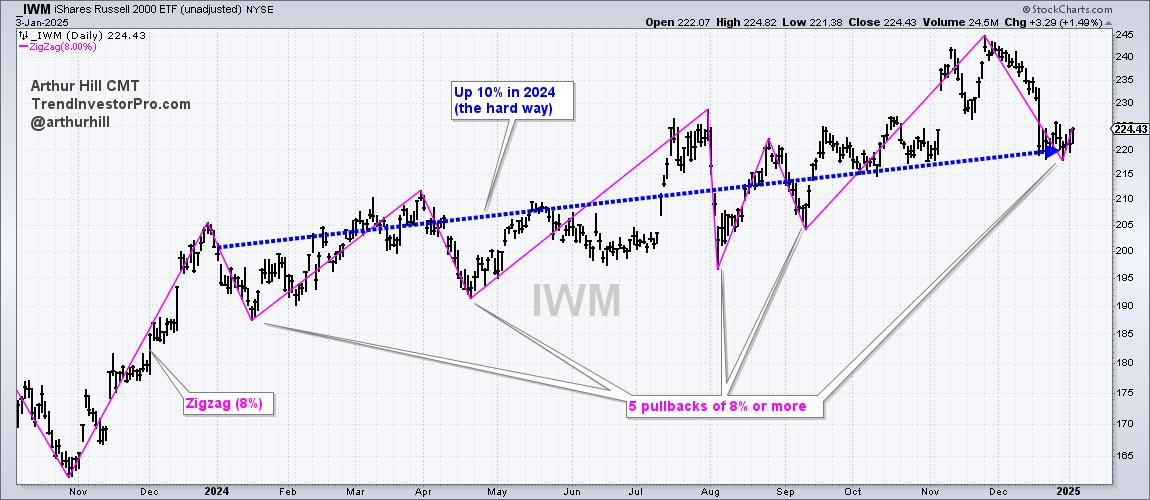
Overall, IWM advanced 10% in 2024. That seems like a good year, but it was a “hard” 10% when we include the five 8+ percent pullbacks. This is simply the nature of small-cap stocks. They are less “trendy” than large-caps and have higher betas, making them more susceptible to wider fluctuations. Traders need to consider this when trading small-caps. As noted in Chart Trader this week, we see similar price action in the S&P 500 EW ETF (RSP) and S&P MidCap 400 SPDR (MDY).
Click here to take Chart Trader trial and get immediate access.
Buying upside breakouts is probably not the best strategy for trading IWM. Instead, traders should consider pullbacks and mean-reversion opportunities. We can identify such opportunities using Bollinger Bands (20,2) and %B (20,2). The middle line on the Bollinger Bands is the 20-day SMA and the bands are two standard deviations above and below. A close below the lower band means price fell two standard deviations and this creates an oversold condition.
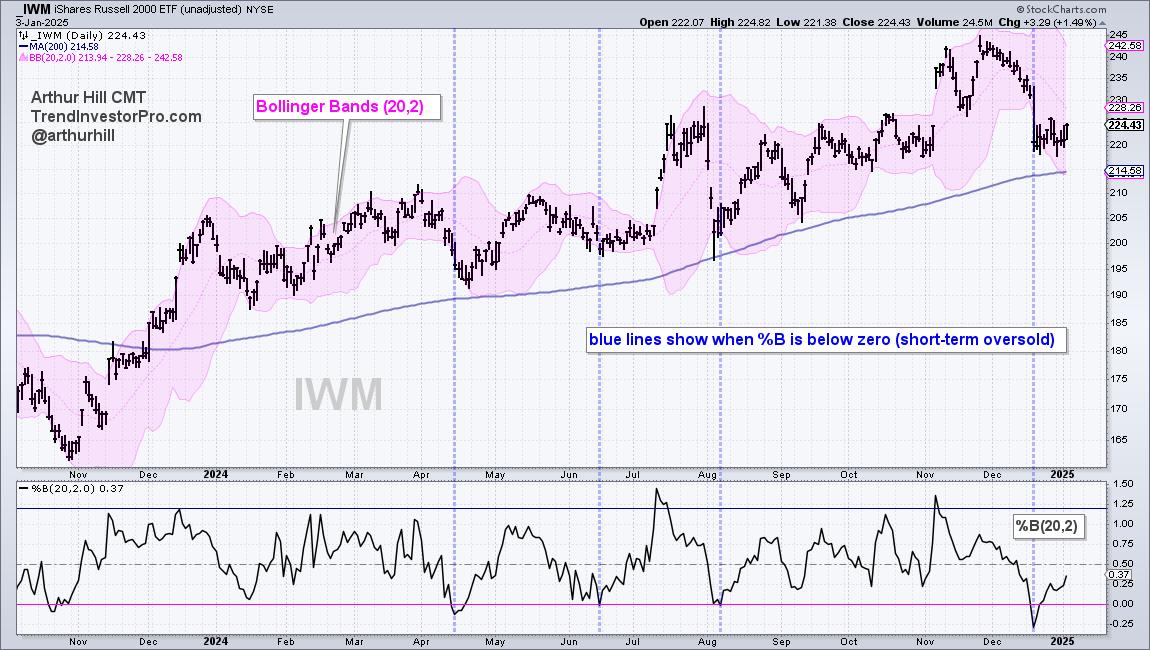
Chartists can quantify oversold conditions using %B, which falls below 0 when the close is below the lower Bollinger Band. The blue lines on the chart above show %B dipping below 0 four times in 2024. Note that I would also only look for oversold conditions when price is above the 200-day SMA (long-term uptrend). When the bigger trend is up, a close below the lower Bollinger Band signals an oversold condition that can lead to a bounce.
December was a rough month for many stocks and ETFs. Even so, the weight of the evidence remains bullish for stocks and these pullbacks look like corrections within bigger uptrends. This week’s reports and videos focused on long-term breadth indicators, short-term oversold breadth, leading ETFs and a dozen ETFs with tradable pullbacks.
Click here to take a Chart Trader trial and get immediate access.
///////////////////////////////////////////////


