Overall Analysis
The Dollar Index continues its rally to the upside, with price action showing weakness on the daily and hourly time frames.
Chart Analysis

USD 15-Minute Time Frame
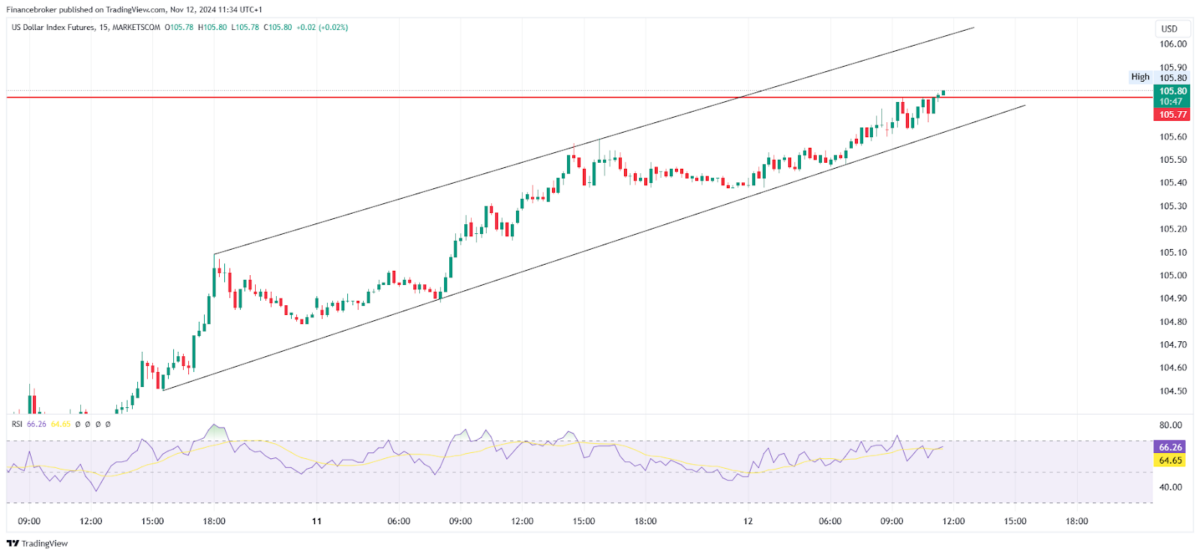
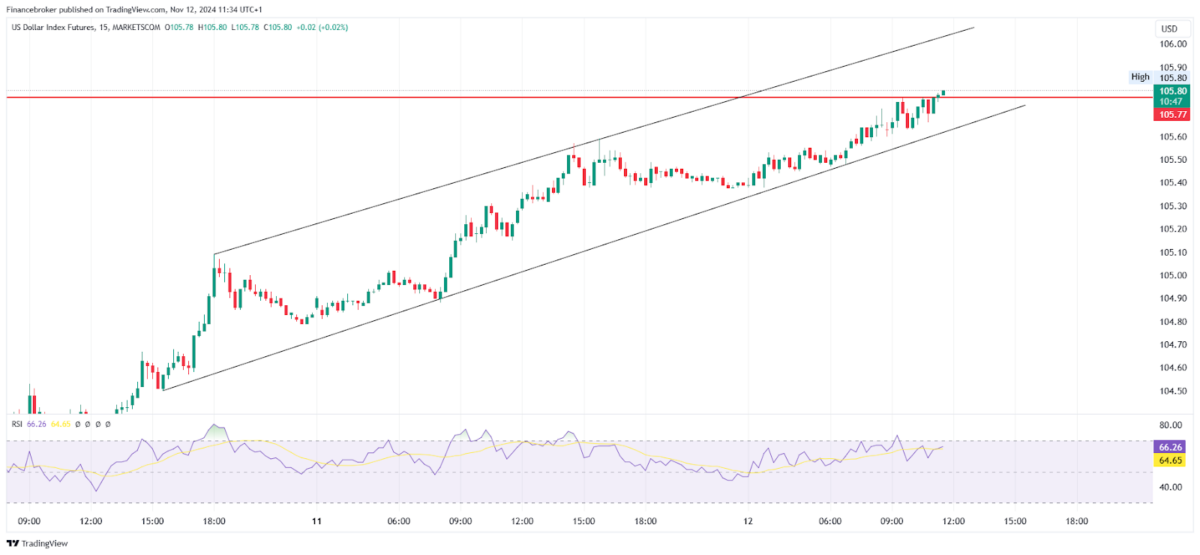
On November 11, 2024, the Dollar Index increased by 0.50%, currently trending upwards within a channel. The price might face strong rejection at the 105.77 level, as the previous swing high will act as resistance.
On the daily time frame, the price broke out of a flag-and-pole pattern on November 6, 2024, and continued its rally. Currently, the price might face rejection at the 105.77 level, which is a strong resistance area. The price has moved up without pausing. However, it needs to close above the 105.77 level on the daily chart to continue the uptrend.
On the 1-hour time frame, a strong upward channel is visible, creating key support and resistance levels. If the price fails to stay within the channel and breaks down, selling pressure could push the price down to the 104.80 level.
In the 15-minute time frame, there is strong momentum for the uptrend within the channel structure. Compared to the hourly and daily time frames, the 15-minute time frame shows more strength.
Overall, on higher time frames, the price has moved up quickly without forming significant swings or pauses, weakening the trend. In contrast, the 15-minute time frame has shown proper swings and enough pauses, making it safer for short-term traders.
Entry Triggers
For potential entries, here are the triggers to consider:
- If the price on the 15-minute time frame breaks the supporting trendline and sustains below it, sellers may consider entering the trade with a stop loss above the previous swing high and target levels at 105.30 and 104.90, based on a trailing stop.
- On the daily time frame, if the price closes above the 105.77 level, positional buyers may consider entering the trade with a stop loss below the previous candle’s low, targeting 106.31 and 107.03 on a trailing basis.
- On the 1-hour time frame, if the price breaks the supporting trendline and continues below it, sellers may consider entering the trade with a stop loss above the previous swing high and a target of 104.80.
The post Dollar Index Analysis: Strong Uptrend Faces Resistance Level appeared first on FinanceBrokerage.


