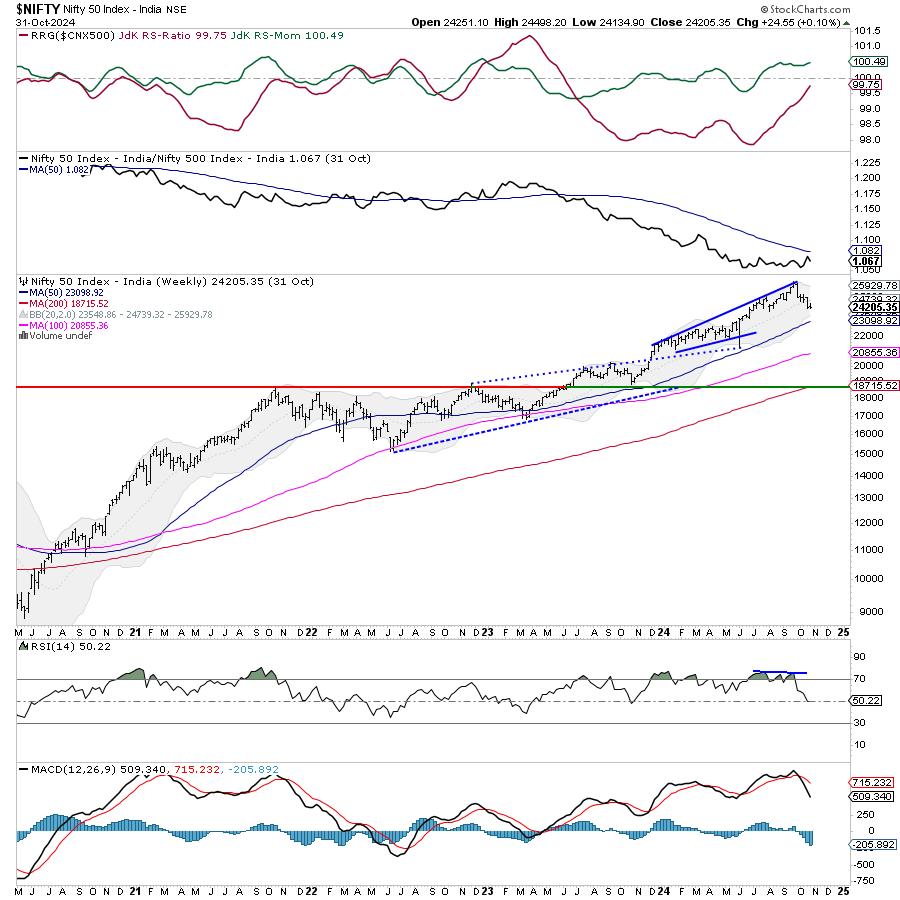
The Nifty largely consolidated over the past five sessions but did so with a bearish undertone. The Nifty traded in a defined range and closed the week with a modest gain. Importantly, the index also stayed below its crucial resistance points. The volatility also expanded; the India VIX surged higher by 8.68% to 15.90 on a weekly basis. Given the ranged move by the markets, the trading range got narrower. The Nifty oscillated in a 363-point range; this was much less than the previous week. Following a largely consolidating but bearish setup, the headline index closed with a modest weekly gain of 123.55 points (+0.51%).
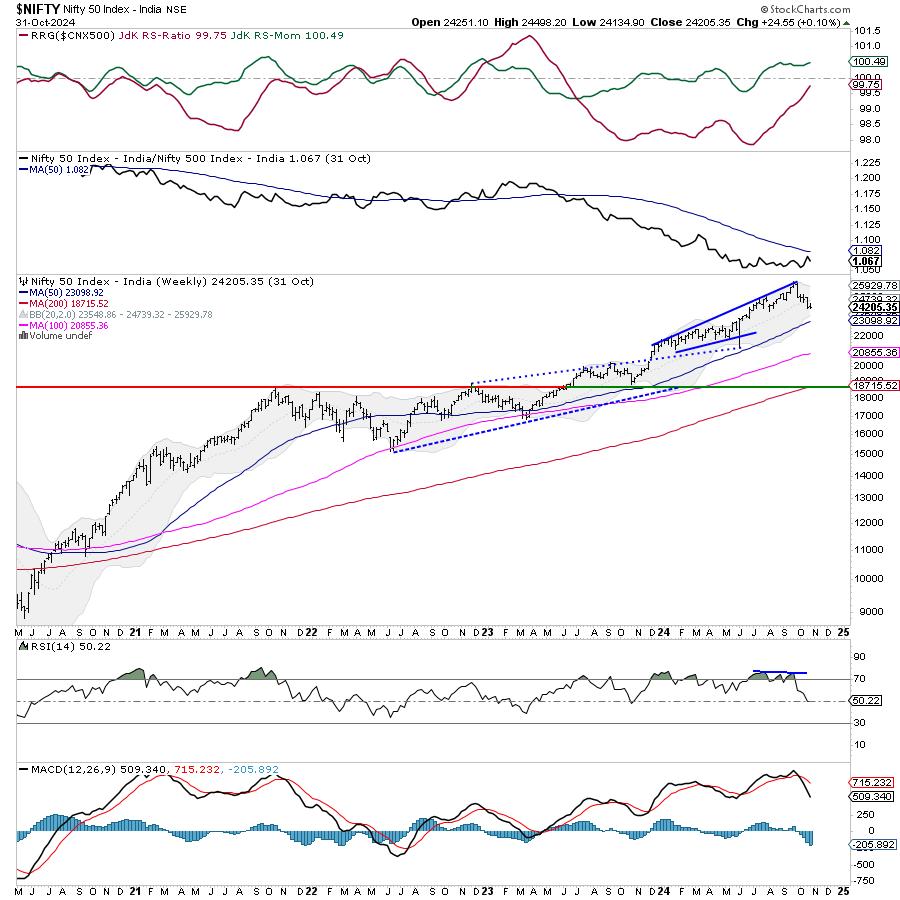
It was a four-day trading week as Friday just had a short one-hour symbolic ceremonial Mahurat Trading session. In the week before this one, the Nifty had violated and closed well below the 100-DMA which currently stands at 24669. The Index has also violated the 20-week MA placed at 24744. This makes the zone of 24650–24750 the most important market resistance area. So long as the Nifty stays below this zone, no trending and sustainable upmove shall occur in the markets. In other words, so long as the Nifty stays below this crucial resistance zone, it remains vulnerable to continued selling pressure. The most immediate support zone for the Nifty now stands at 23900; the markets would get weaker if this level is breached on the downside.
The global markets are expected to give a stronger handover; given this thing, the Indian markets may see a stable start to the week on Monday. The levels of 24450 and 24580 would act as immediate resistance points. The supports come in at 24120 and 23900.
The weekly RSI stands at 51.24; it remains neutral and does not show any divergence against the price. The weekly MACD is bearish and trades above the signal line.
The pattern analysis of the weekly charts shows strong momentum on the downsides for Nifty. The 20-DMA is showing a steep decline; it has already crossed below the 50-DMA and it is about the cross below the 100-DMA as well. This indicates strong selling pressure and has increased the possibility of the Nifty staying in an intermediate downtrend for some more time. The resistances have been dragged lower; technical rebounds, as and when they happen, would find resistance between 24650-24750 levels.
All in all, even if the Nifty gets a stable and firm start to the week, it is not out of the woods as yet. Any technical rebounds, as and when they take place, should be chased very cautiously. All up moves shall face resistance at the levels of 24600 and higher; there is a greater likelihood that these rebounds are likely to get sold into at higher levels. It is strongly recommended that leveraged positions must be kept at modest levels and all profits on either side must be guarded vigilantly. A highly cautious approach is advised for the coming week.
Sector Analysis for the coming week
In our look at Relative Rotation Graphs®, we compared various sectors against CNX500 (NIFTY 500 Index), which represents over 95% of the free float market cap of all the stocks listed.
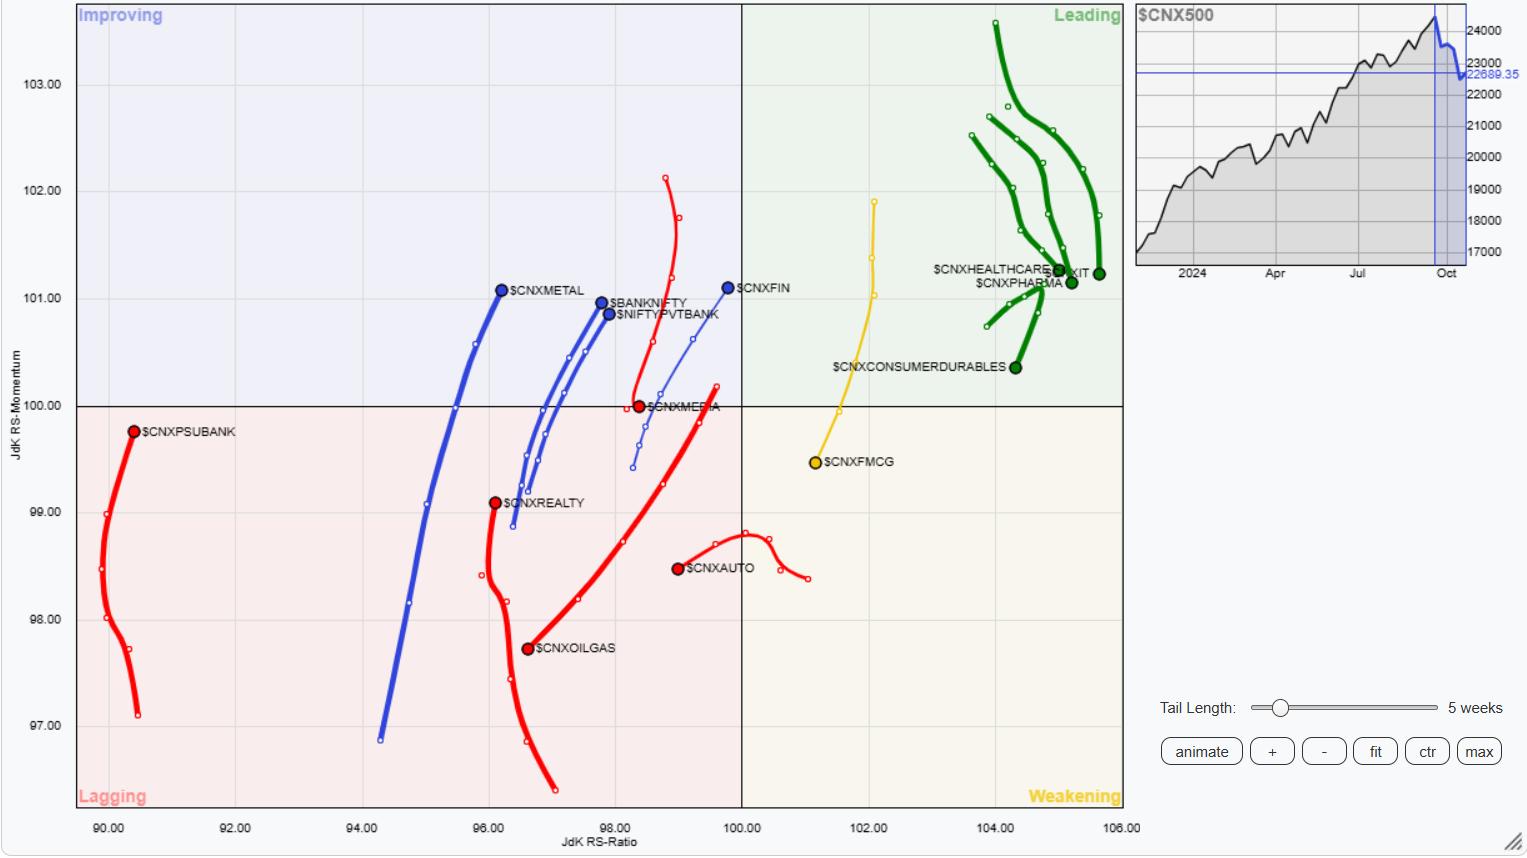
Relative Rotation Graphs (RRG) do not show any major change in the sectoral setup. The Nifty Pharma, Services Sector, IT, and Consumption Indices are inside the leading quadrant of the RRG. Even though a couple of them are slowing down in their relative momentum, these groups are likely to relatively outperform the broader markets.
The Nifty FMCG and Midcap 100 index are the only two groups inside the weakening quadrant; they may also continue to slow down on their relative performance against the broader markets.
The PSU Bank Index, Realty, Infrastructure, Media, PSE, Auto, Energy, and Commodities indices are inside the lagging quadrant. Among these, the Energy, Auto, PSE, and Media Index may relatively underperform the broader markets. The rest are improving sharply on their relative momentum and may eventually improve their relative performance against the broader market.
The Nifty Bank, Metal, and Financial Services index are inside the improving quadrant and may continue improving their relative performance against the broader markets.
Important Note: RRG™ charts show the relative strength and momentum of a group of stocks. In the above Chart, they show relative performance against NIFTY500 Index (Broader Markets) and should not be used directly as buy or sell signals.
Milan Vaishnav, CMT, MSTA
Consulting Technical Analyst
www.EquityResearch.asia | www.ChartWizard.ae


