 After yesterday’s “trick,” investors received a “treat” at the end of the trading week, as the stock market regained its footing and bounced back a bit.
Even though the October nonfarm payrolls were much weaker than expected—up by 12,000 when the Dow Jones estimate was for an increase of 100,000 jobs—the market shook it off. The decline is attributed to Boeing’s strike and two major hurricanes. According to a recent Barron’s report, the Bureau of Labor Statistics survey responses were below average, so the data may be skewed. Unemployment is steady at 4.1%, and wages grew by 4.4% annually.
Stocks Bounce Back
The data doesn’t indicate the US economy is heading toward a recession. The major stock market indexes bounced back, with the Nasdaq Composite ($COMPQ) gaining the most after Thursday’s spooky selloff. However, Friday’s bounce didn’t change the Nasdaq’s big picture (see daily chart below).
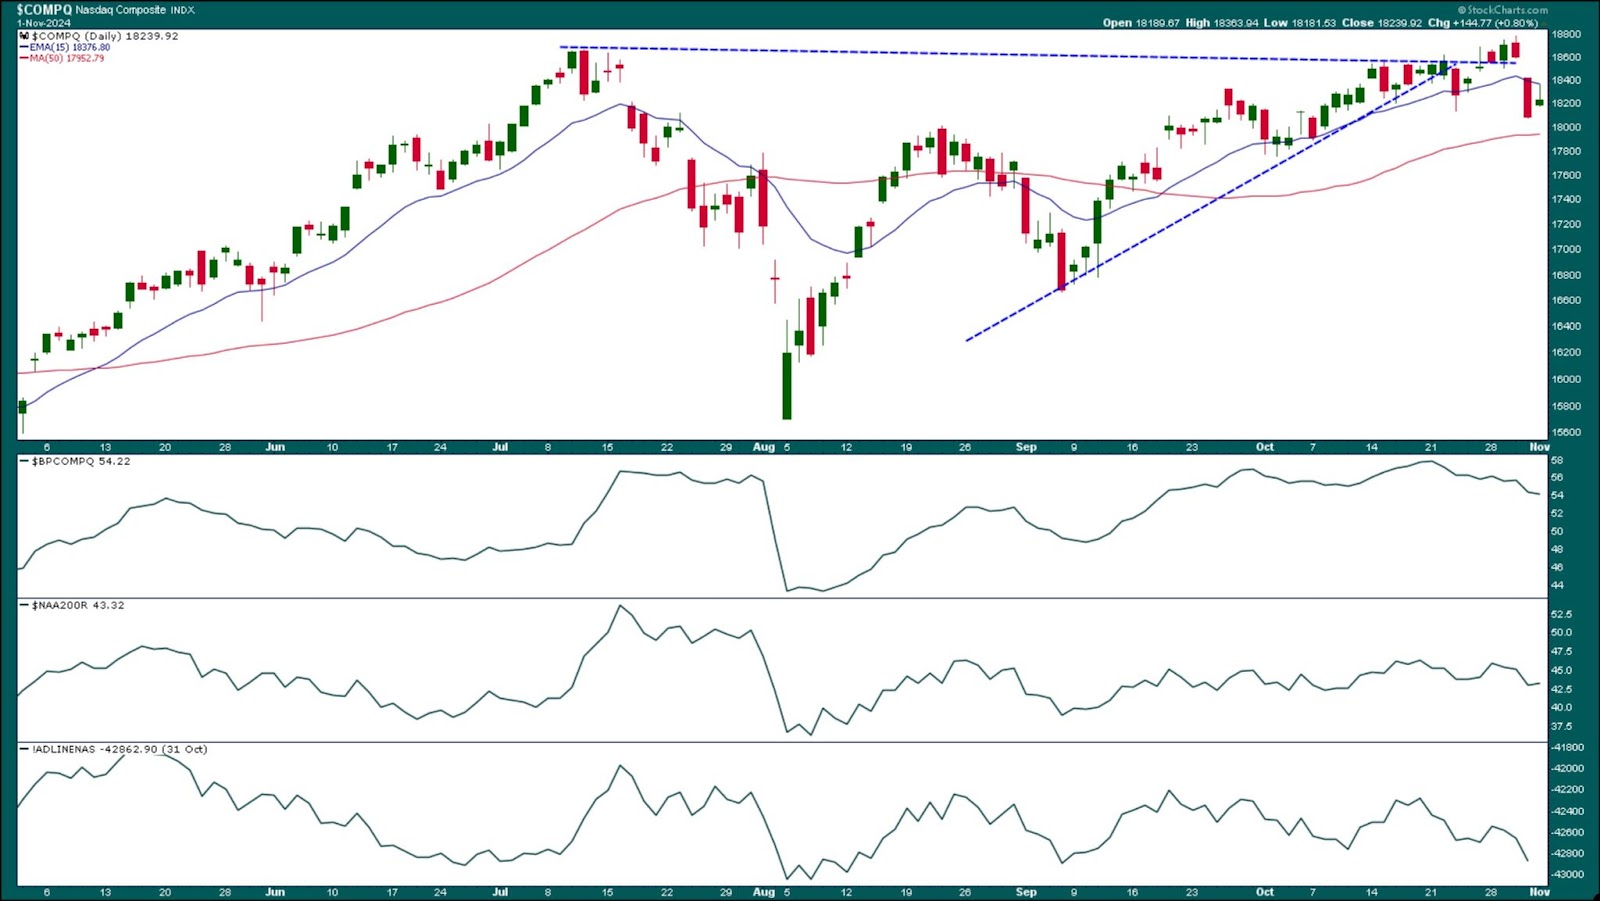
FIGURE 1. NASDAQ COMPOSITE SHOWS DOWNSIDE MOVEMENT. Friday’s selloff didn’t change the technical picture. The index needs to close above its 21-day EMA to reverse the downside move.Chart source: StockCharts.com. For educational purposes.
The Nasdaq broke above its tight consolidation range on Monday, but, after Thursday’s selloff, it closed well below its 15-day exponential moving average (EMA). Friday’s rebound didn’t change the technical picture. The index went as high as the 15-day EMA, but closed below it in what resembles an inverted hammer, although it didn’t close lower than Thursday’s close.
There is a weakening in market breadth, as displayed by the breadth indicators—Bullish Percent Index, Percentage of Nasdaq stocks trading above their 200-day moving average, and the Advance/Decline Line—displayed in the lower panels.
Small Caps Ain’t Getting Much Love
With interest rate cuts already in play and with more to come, you would think that small-cap stocks would start getting some attention. But we haven’t seen that yet. Even though the S&P 600 Small Cap Index ($SML) broke above a trading range on the weekly chart, there’s not enough buying pressure to send the index into an uptrend.
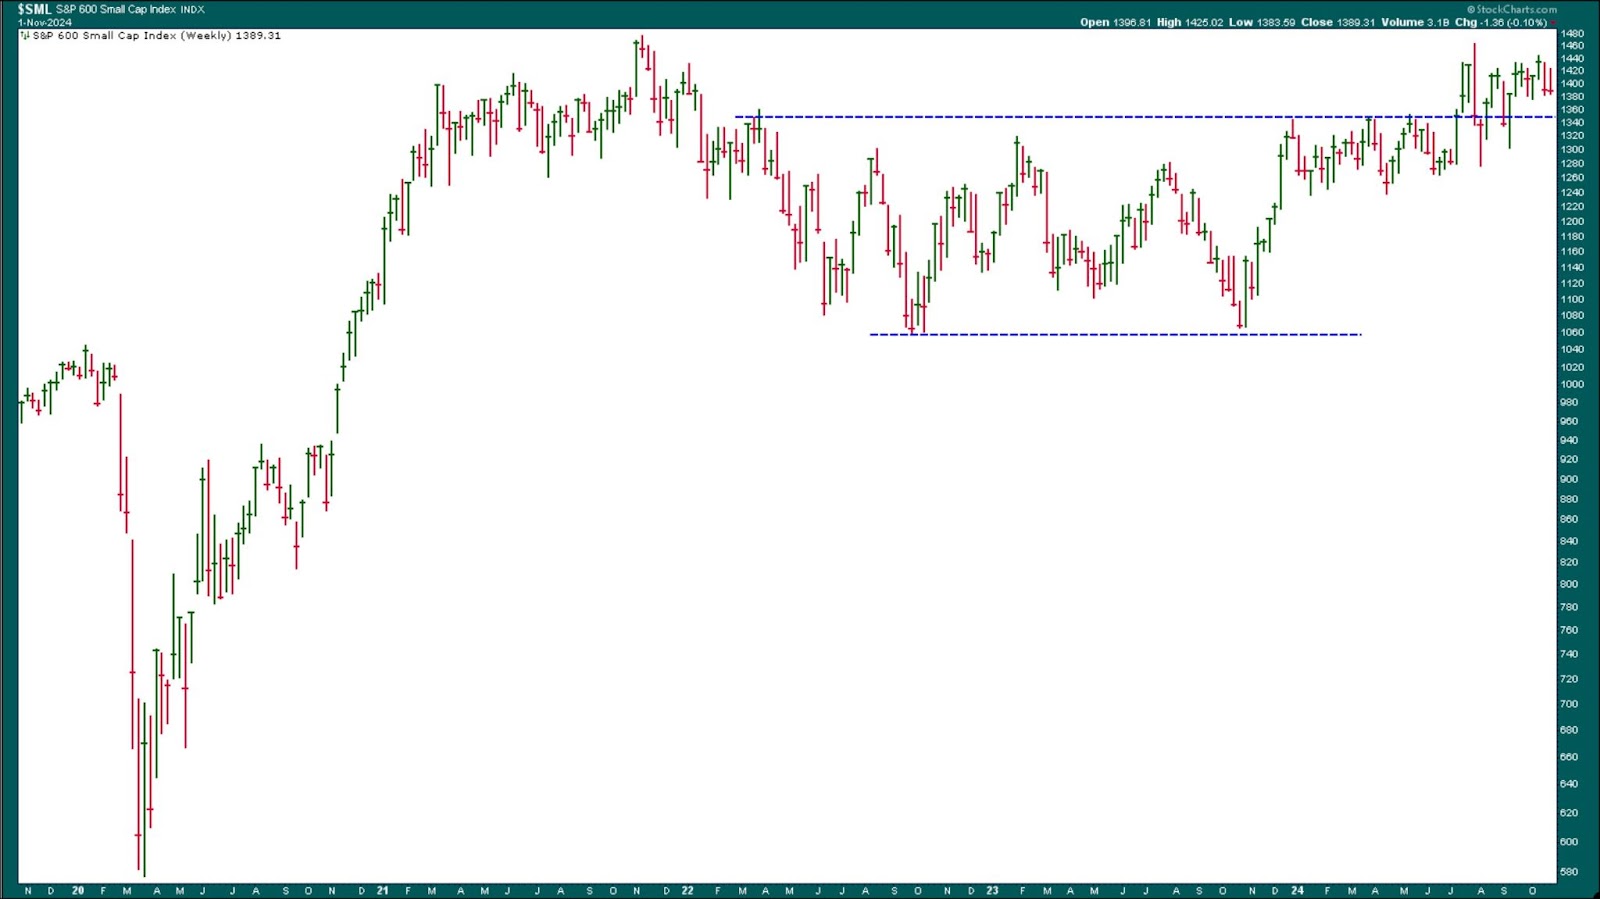
FIGURE 2. SIDEWAYS FOR SMALL-CAP STOCKS. The high probability of a 25-basis-point interest rate cut at the next FOMC meeting isn’t helping small-cap stocks, which continue to trade in a consolidation.Chart source: StockCharts.com. For educational purposes.
Treasury Yields Jump
Yields fell after the weak jobs report, but that was short-lived. Treasury yields reversed and climbed higher, with the 10-year US Treasury yield closing at 4.36% on Friday (see chart below). $TNX is trading above its 15-day EMA. The question now is whether $TNX will reach its July 1 high.
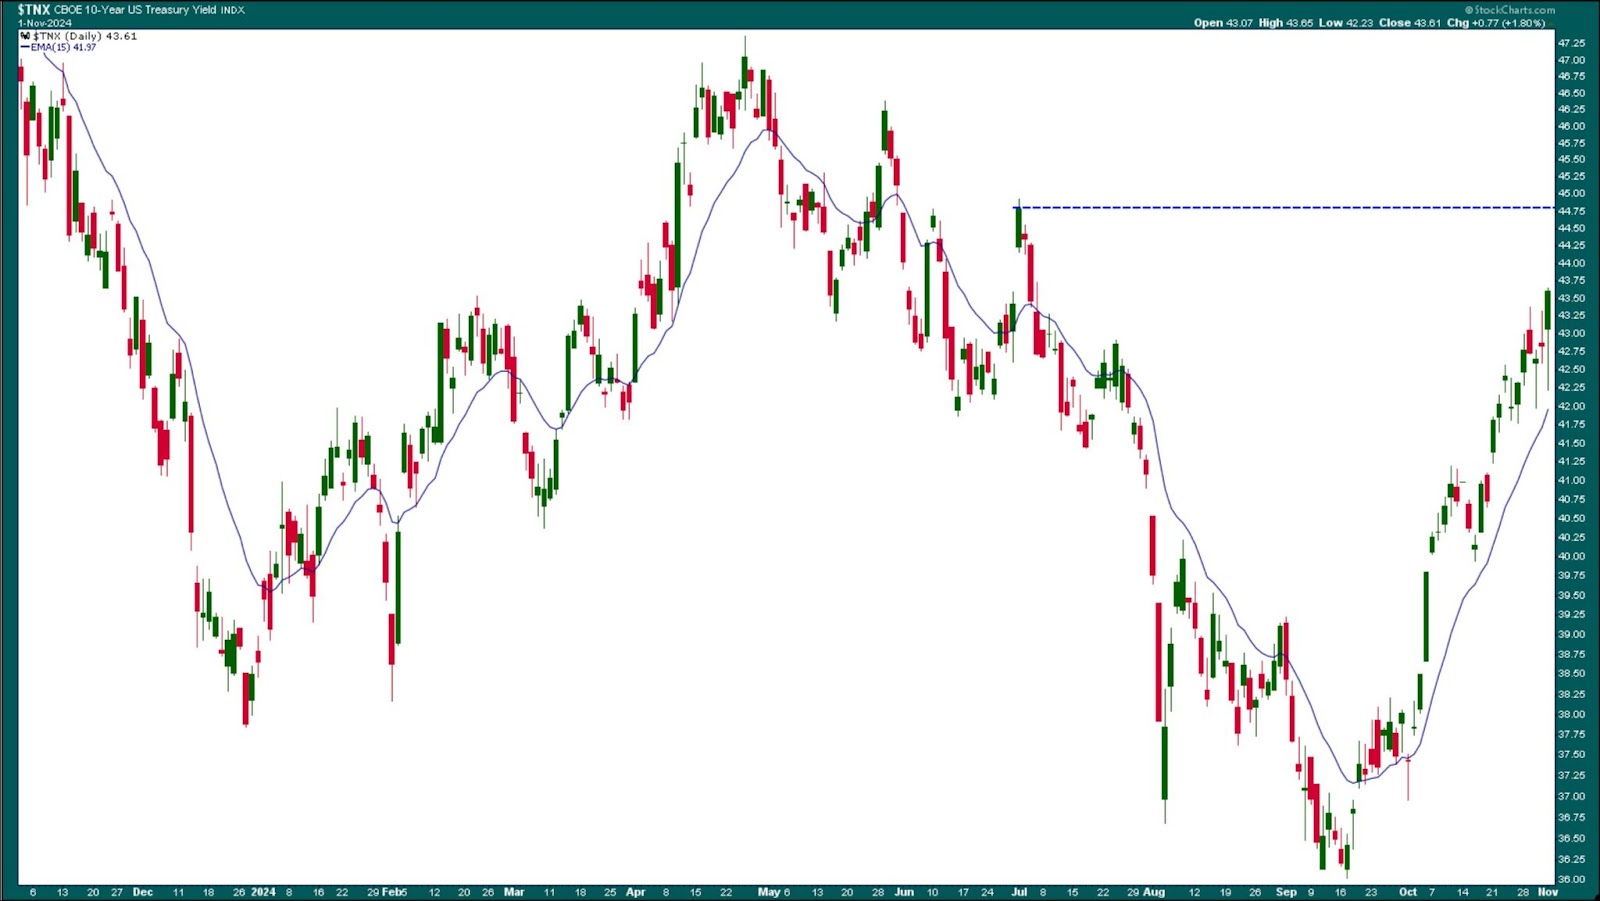
FIGURE 3. 10-YEAR US TREASURY YIELD INDEX ($TNX) KEEPS ON RISING. $TNX has been on a steady rise since the end of September, when it broke above its 15-day EMA.Chart source: StockCharts.com. For educational purposes.
Treasury yields have been trending up after breaking above the 15-day EMA at the end of September. The rise in yields doesn’t help bond prices, which move in the opposite direction.
The iShares 20+ Year Treasury Bond ETF (TLT) has been trading below its 15-day EMA since September 19, and Friday’s price action was very bearish (see chart below).
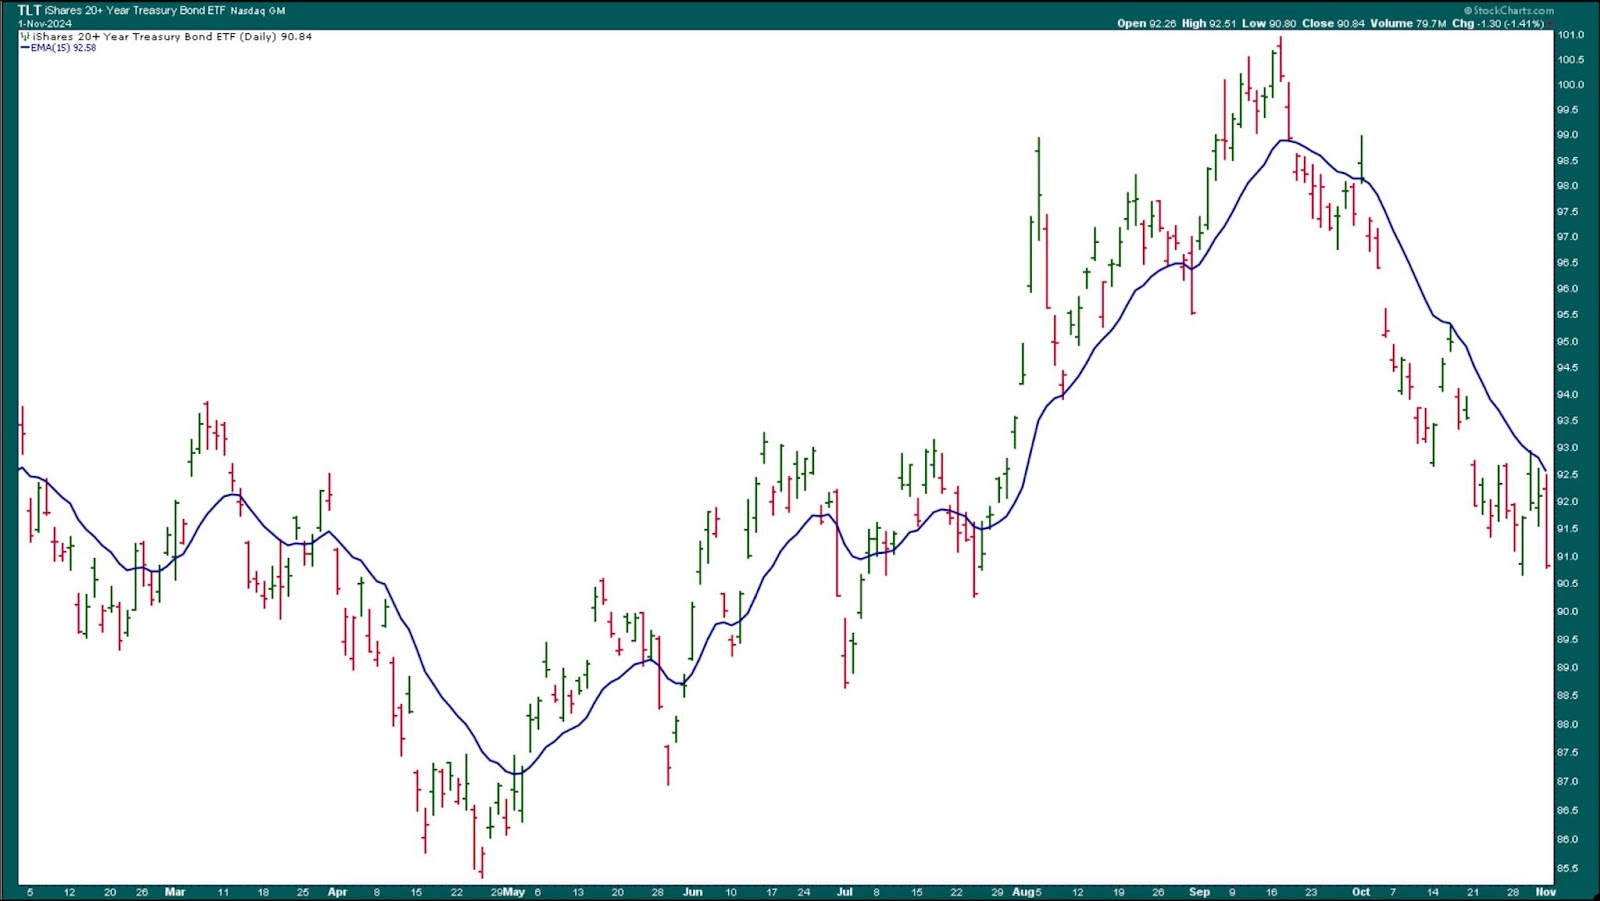
FIGURE 4. BOND PRICES SINK. The iShares 20+ Year Treasury Bond ETF (TLT) has been cascading lower since mid-September when it broke below its 15-day EMA.Chart source: StockCharts.com. For educational purposes.
While Treasury yields climb, the economic data shows the economy is growing while the labor market is cooling. This supports the narrative of an interest rate cut. The CME FedWatch Tool shows a 99.7% probability of a 25-basis-point interest rate cut on November 7.
Next week could bring some volatile action to the market, although given the way the stock market has been acting in the last two weeks, there’s no telling what it will do. The best you can do is take it one day at a time.
End-of-Week Wrap-Up
- S&P 500 closed down 1.37% for the week, at 5728.80, Dow Jones Industrial Average down 0.15% for the week at 42,052.19; Nasdaq Composite closed down 1.50% for the week at 18,239.92
- $VIX up 7.62% for the week, closing at 21.88
- Best performing sector for the week: Communication Services
- Worst performing sector for the week: Real Estate
- Top 5 Large Cap SCTR stocks: Summit Therapeutics (SMMT); Reddit Inc. (RDDT); Ubiquiti, Inc. (UI); Applovin Corp. (APP); Carvana (CVNA)
On the Radar Next Week

- US Presidential Election
- October ISM Services PMI
- Fed Interest Rate Decision
- Fed Press Conference
- November Michigan Consumer Sentiment Index
- Earnings from Palantir Technologies (PLTR), Marathon Petroleum Corp. (MPC), Novo Nordisk (NVO), Arm Holdings (ARM), Gilead Sciences (GILD), Applovin Corp (APP), among many others.
Disclaimer: This blog is for educational purposes only and should not be construed as financial advice. The ideas and strategies should never be used without first assessing your own personal and financial situation, or without consulting a financial professional.


