


Oil and Natural Gas: Friday brought oil above $70.00
- Oil’s price managed to get back above $70.00 last week, forming a new weekly high at $70.32
- The price of natural gas rose to $2.56 on Friday
Oil chart analysis
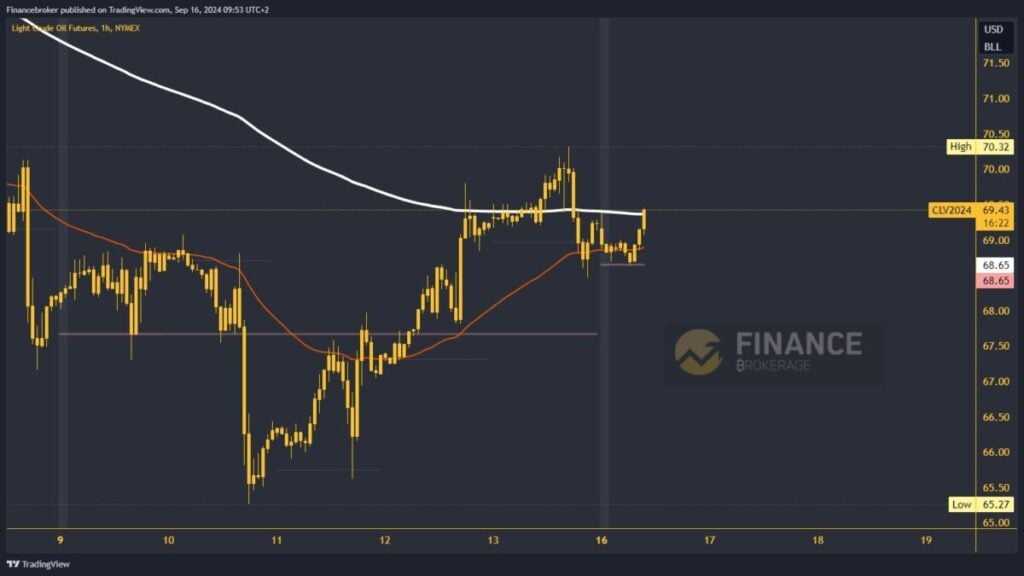
Oil’s price managed to get back above $70.00 last week, forming a new weekly high at $70.32. Soon after, however, the price lost its bullish momentum and began to retreat below the $70.00 level. Strong bearish impulses pushed the price back to the $68.50 support level. During this morning’s Asian trading session, the price was holding above the $68.65 daily open price. With the beginning of the EU session, oil starts a bullish consolidation and jumps over the $69.00 level.
The price is near $69.50, which will test the EMA 200 moving average. The current momentum looks promising for a move above the moving average. With its support, optimism for a continuation to the bullish side is increasing. Potential higher targets are the $70.00 and $70.50 levels. For the bearish option, a drop in oil price below the $68.65 daily open price would mean a return to the bearish side. After that, we will see a descent and testing of lower levels on the chart.
Natural gas chart analysis
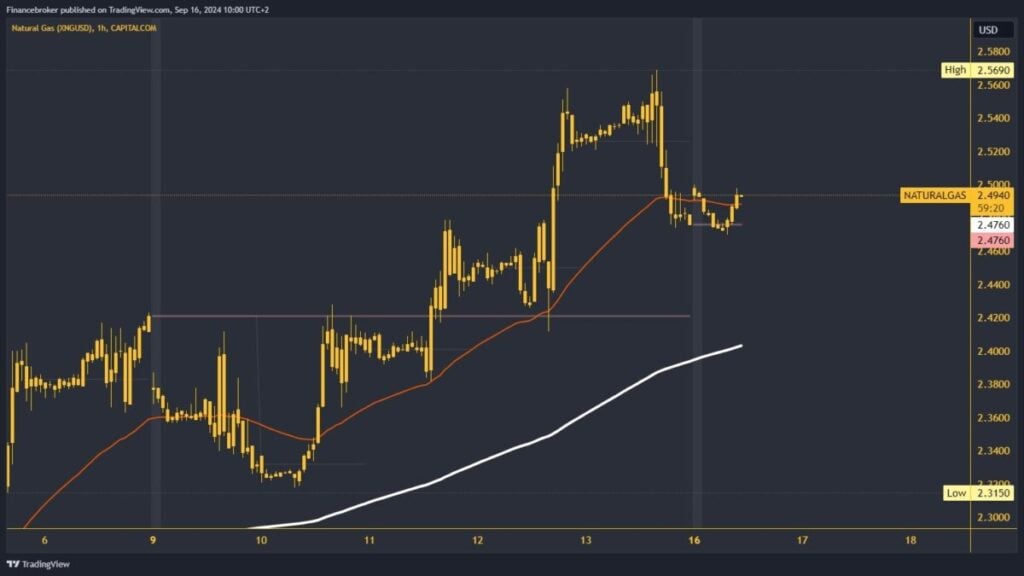
The price of natural gas rose to $2.56 on Friday. After that, there was another pullback to the $2.47 support level. We managed to hold above this morning and get back up to $2.50. The price of natural gas is now back on the bullish side, with the EMA 50 moving average support. We expect a continued recovery in the EU session and the formation of a new daily high.
Potential higher targets are the $2.52 and $2.54 levels. For a bearish option, the price would have to first pull back below the $2.47 support this morning. After that, natural gas will be on the negative side and under pressure to go into a deeper drawdown. Potential lower targets are the $2.44 and $2.42 levels. The EMA 200 moving average is in the $2.40 zone; there, we hope for support or a slowdown in the pullback.
The post Oil and Natural Gas: Friday brought oil above $70.00 appeared first on FinanceBrokerage.