


Tech Rallies But Remains Inside the Lagging Quadrant
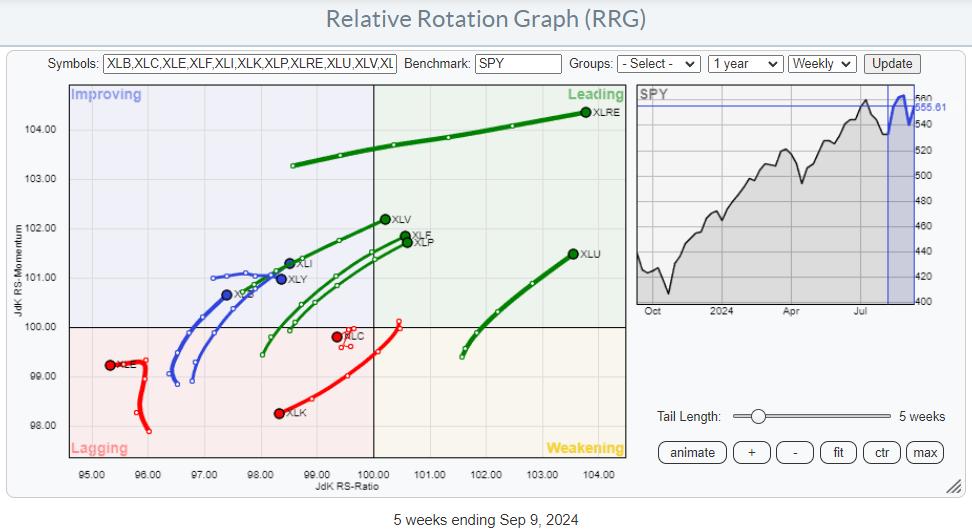
A quick look at the Relative Rotation Graph for US sectors reveals that the Technology sector is still the main driving force for the market. The technology sector now makes up more than 30% of the market capitalization of the S&P 500, so it significantly influences the price (movement) of the S&P 500 index.
On this weekly RRG above, the XLK tail is seen heading further into the lagging quadrant, together with XLC and XLE.
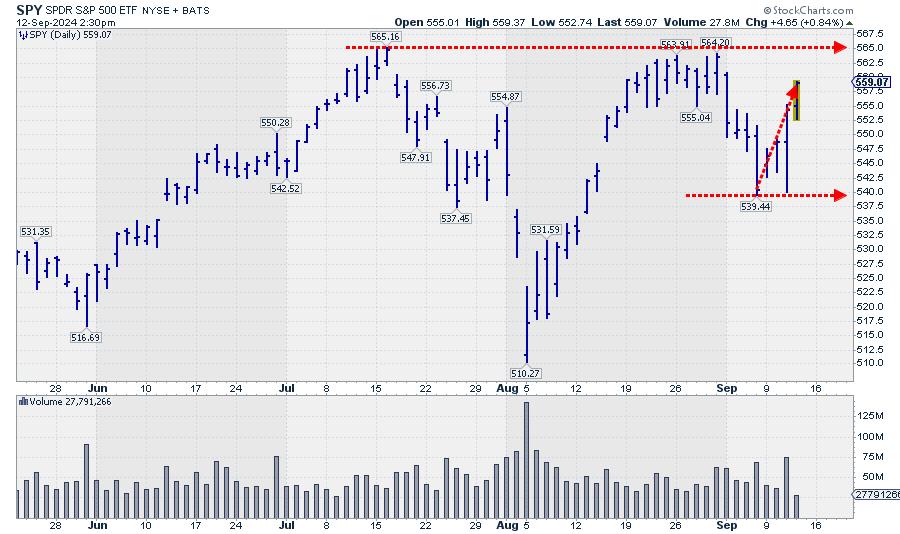
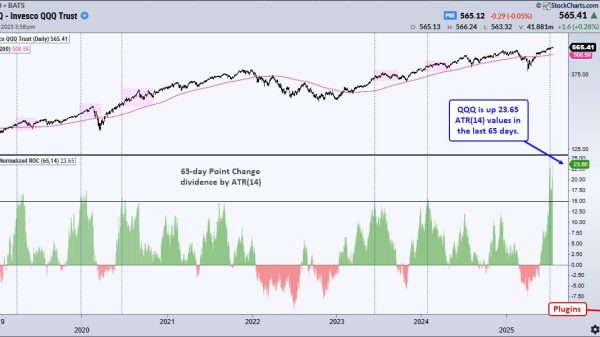
After dipping to the 540 area at the end of last week, the market has recovered some of that ground so far this week. This move has now established the area around 540 as support, while overhead resistance still remains intact around 565. A break of either level will very likely ignite an acceleration in the direction of the break.
On the weekly RRG, this move has had no material impact so far.
The Daily RRG Shows Some Improvement
Only when zooming in on the daily Relative Rotation Graph shows this week’s improvement.
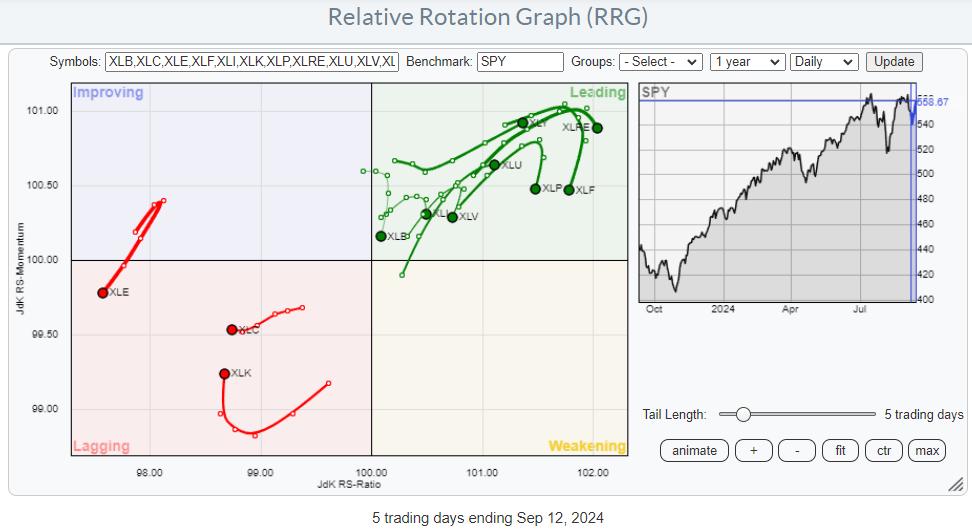
What is interesting to see on this daily RRG is that the same three sectors that are inside the lagging quadrant on the weekly RRG are also inside the lagging quadrant on this daily RRG. XLC and XLE clearly confirm their relative downtrends by rotating at a negative RRG-Heading.
The uptick in tech stocks so far this week has only caused an improvement in relative momentum but not (yet) in relative strength.
But Its Based On a Narrow Foundation
Zooming in on the technology sector members and using the table below to examine their performance over the last five trading days, the RRG provides some insight into where this jump in performance is coming from.
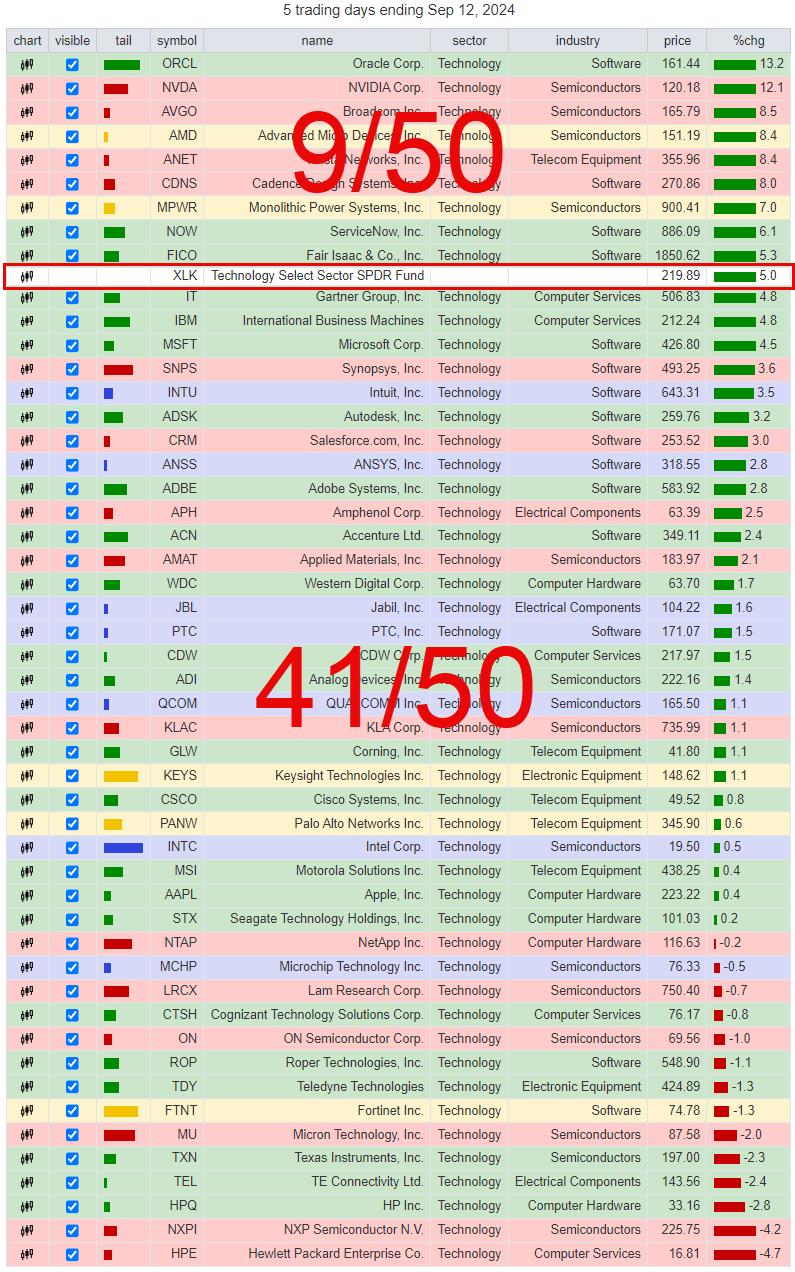
With XLK up 5% so far this week, only 9 out of the 50 stocks in this group outperform SPY. The other 41 are below XLK. With NVDA being one of the top-ranking stocks, this group is already pulling performance up by its market capitalization, especially because MSFT, the other big name inside XLK, is only 0.5% below XLK.
Therefore, the foundation of this tech rally so far is very narrow…again.
Based on these observations, I will judge the current tech rally as a
Recovery within an established relative downtrend.
Defensives Pushing Into Leading RRG Quadrant
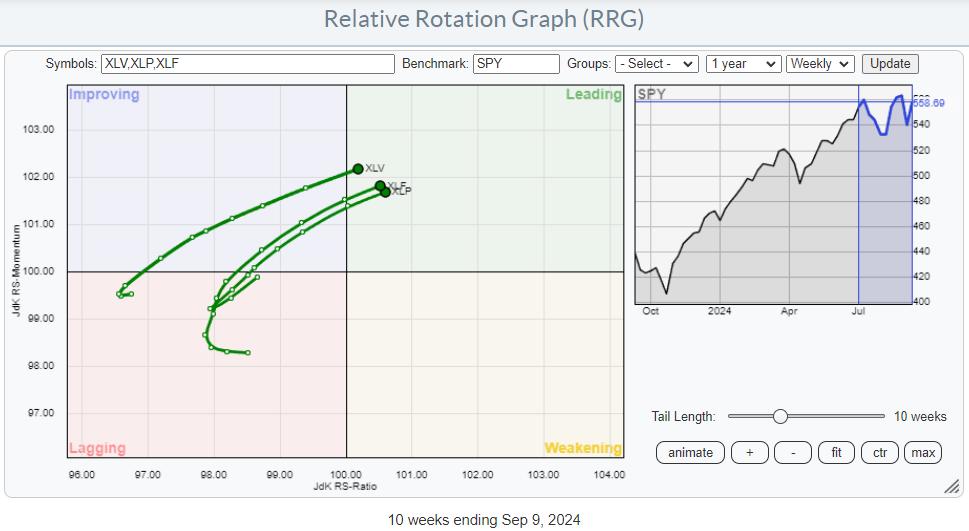
On the opposite side of the spectrum, three sectors seem very well positioned for further outperformance.
XLV (Health Care), XLF (Financials), and XLP (Consumer Staples) have all just entered the leading quadrant, which means a turnover from a relative downtrend into a relative uptrend against SPY. All three are rotating at a positive RRG-Heading, and all three are showing an increasing RRG-Velocity.
Looking at their individual charts combined with relative strength and their RRG-Lines, one sector stands out with a setup we have seen before.
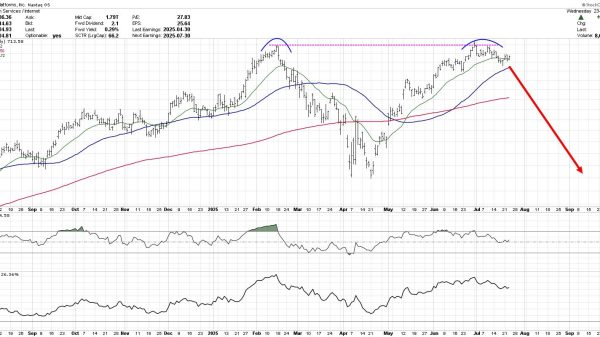
Consumer Staples
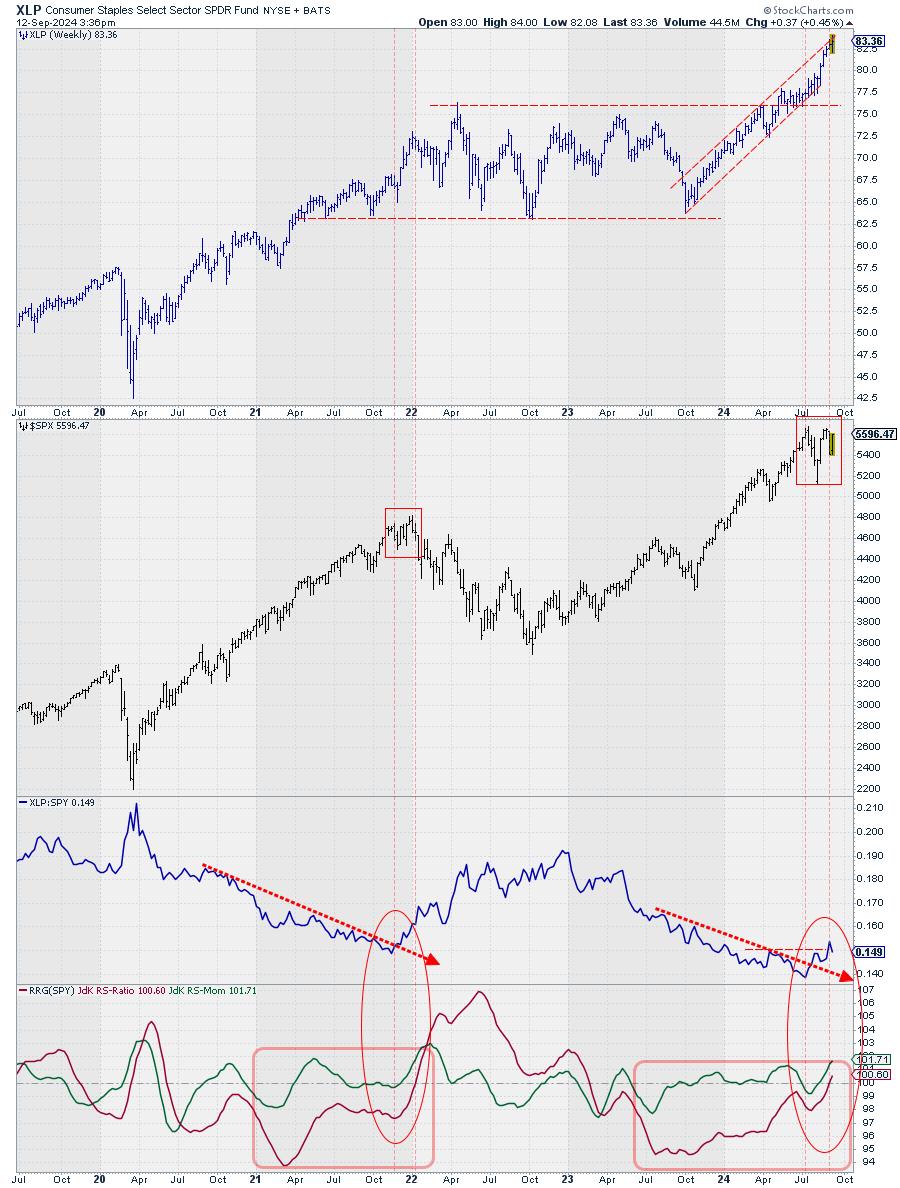
At the end of 2021, the consumer staples sector ended a prolonged period of underperformance (20 months), marked by the first vertical dashed line in November 2021, when the RS-Line broke above a falling resistance line. By then, the JdK RS-Momentum line had already crossed above the 100 level, pushing the XLP tail into the improving quadrant.
A few weeks later, the JdK RS-Ratio line also crosses above 100, and the tail moves into leading. Shortly after that move, the market started to drop, and XLP started to serve its role as a defensive sector, outperforming SPY for more than a year while the market (SPY) dropped 20%.
Fast forward to the present.
The RS-line of XLP has broken above its falling resistance after a downtrend that started at the end of 2022, so almost two years ago, 21 months to be exact. RS-Momentum rose above 100 a few weeks after that event, and this week, RS-Ratio also crossed above 100, pushing the XLP tail into the leading quadrant.
The price moves on the SPY chart are almost identical on both occasions. There is a peak when the RS line crosses upward and a second peak shortly after the RS-ratio line crosses above 100.
Given the defensive nature of the Staples sector and the analogy that seems to be playing out at the moment, I am keeping my cautious/careful approach to the markets.
RISK > POTENTIAL REWARD
#StayAlert, –Julius