


Oil and natural gas: Oil struggles to retain new support
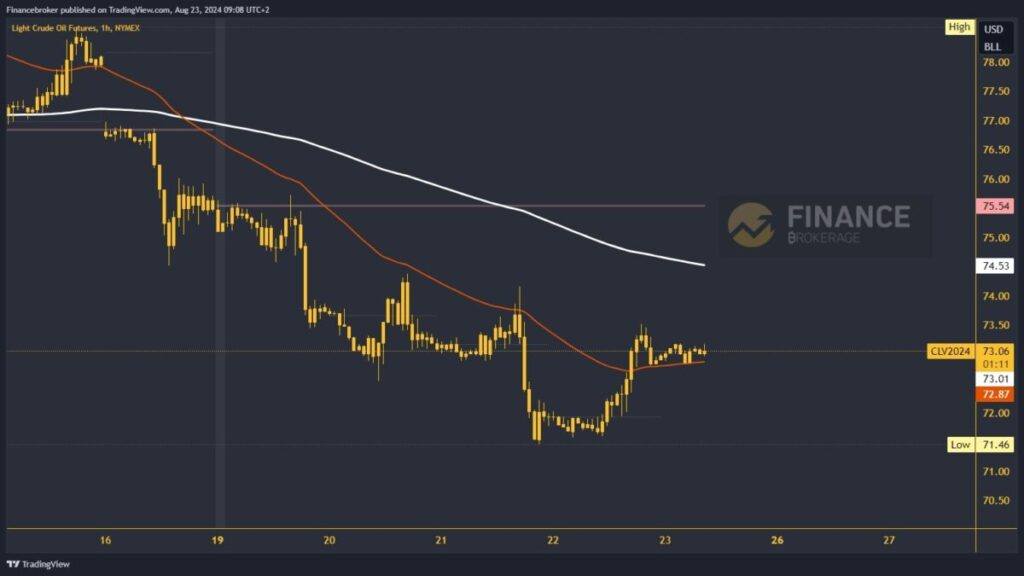
- During this morning’s Asian session, the oil price hovered around the $73.00 level
- Yesterday, the price of natural gas was under a lot of pressure, which caused a strong bearish pullback
Oil chart analysis
During this morning’s Asian session, the oil price hovered around the $73.00 level. The EMA 50 moving average supports the price and is in an excellent position to continue to the bullish side. By rising to $74.00, we would form a two-day high, which would strengthen our bullish recovery. Potential higher targets are $74.50 and $75.00 levels. We will have additional resistance in the EMA 200 moving average in the $74.50 zone.
For a bearish option, the oil price would have to first pull back below the EMA 50 moving average. That would move us below the daily open price to the negative side. With that step, we would form a new daily low, and the price would be under pressure to look for new support. Potential lower targets are $72.50 and $72.00 levels. This week’s low oil price is at $71.46.
Natural gas chart analysis
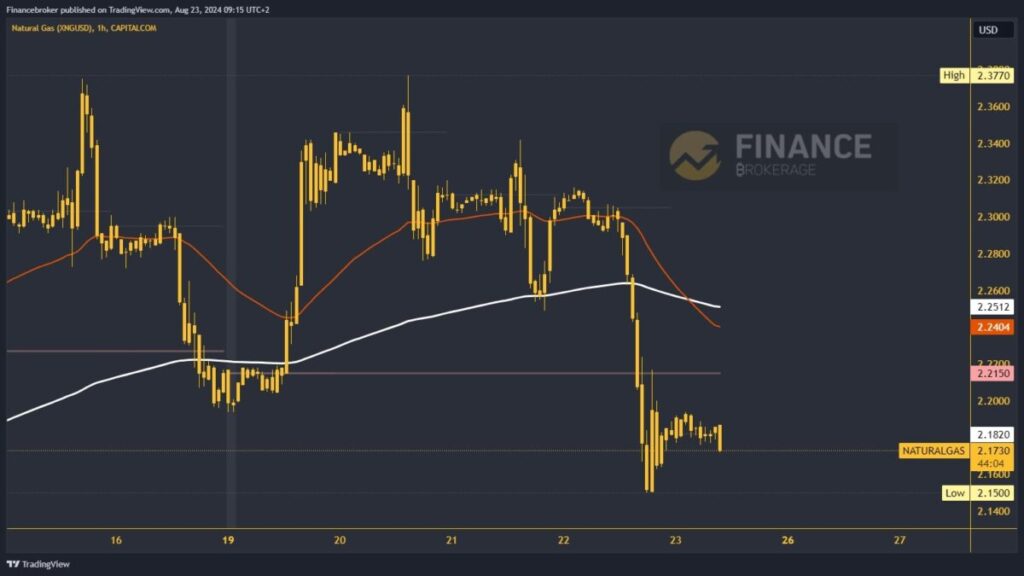
Yesterday, the price of natural gas was under a lot of pressure, which caused a strong bearish pullback. After moving around the $2.30 level, the price collapsed to $2.15. During this morning’s Asian trading session, natural gas moved in the $2.17-$2.19 range. At the start of the EU session, we saw new pressure on gas that could bring down the price again. This could lead to a test of the weekly low and possibly the formation of a new lower low.
Potential lower targets are the $2.14 and $2.12 levels. For a bullish option, we need an impulse above the $2.20 level. That would allow us to start recovery. At $2.22, we will test the weekly open price, and moving and staying above would be preferable. Potential higher targets are the $2.24 and $2.26 levels. We will have a possible higher resistance in the $2.25 zone in the EMA 200 moving average.
The post Oil and natural gas: Oil struggles to retain new support appeared first on FinanceBrokerage.