


Oil and natural gas: oil loses pace and falls again
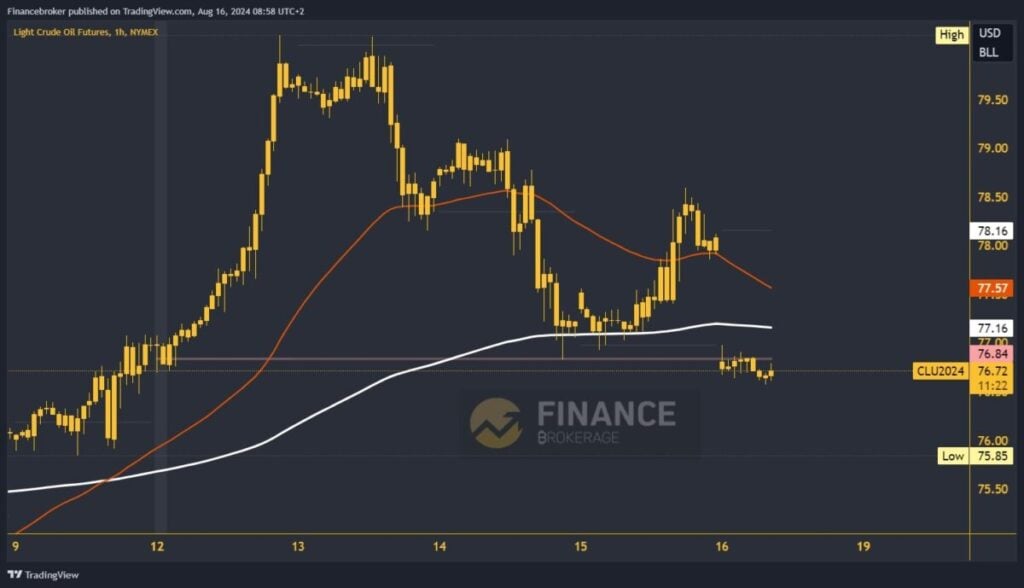
- At the market’s opening this morning, the oil price made a significant bearish gap from $78.16 to $76.80
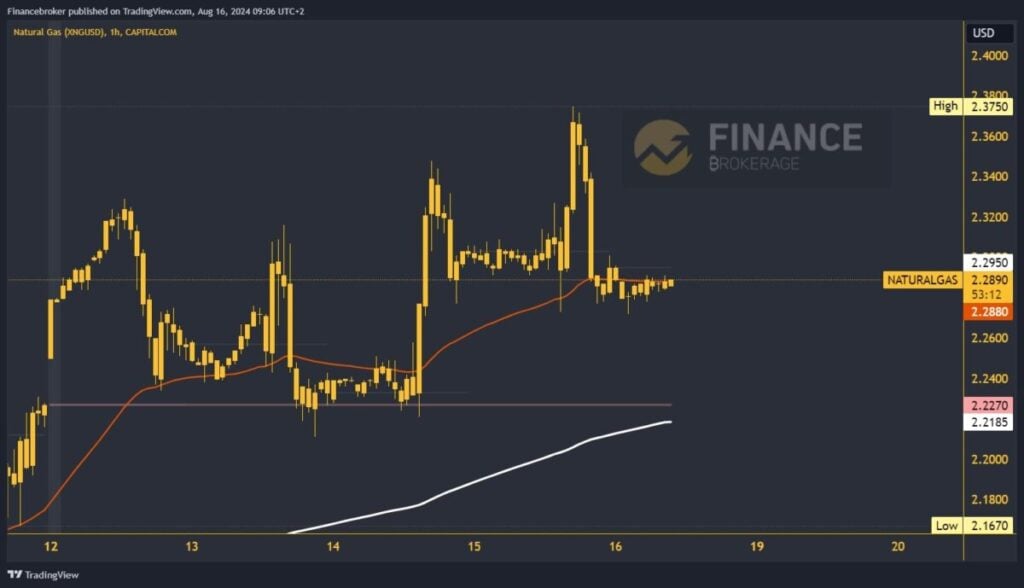
- The price of natural gas rose to a new weekly high on Thursday at the $2.37 level
Oil chart analysis
At the market’s opening this morning, the oil price made a significant bearish gap from $78.16 to $76.80. This movement, which occurred during this morning’s Asian session in the $76.60-$76.80 range, has placed the price below the weekly open price and is under pressure to trigger a further pullback. The EMA 200 moving average, now on the bearish side, adds to this pressure. We’re looking at potential lower targets at $76.50 and $76.00 levels, signaling a cautious outlook.
For a bullish option, it’s crucial that the oil price regains ground above the $77.00 level. This not only brings us back above the weekly open price but also sets the stage for a potential bullish continuation. A move to $77.50 would provide additional support from the EMA 200 moving average, signaling a potential shift in momentum and higher targets at the $78.00 and $78.50 levels.
Natural gas chart analysis
The price of natural gas rose to a new weekly high on Thursday at the $2.37 level. Growth stopped there, and the price initiated a pullback from that level to the $2.27 support level. During this morning’s Asian trading session, the price moved in the $2.27-$2.29 range. Natural gas has stabilized in this zone for now and could initiate a bullish consolidation above the daily open price. With that step, we move to the positive side, and the optimism for the bullish option increases.
Potential higher targets are the $2.32 and $2.34 levels. For a bearish option, we need a negative consolidation and a move down to the $2.26 level. With that step, we move to a new daily low and confirm the weakness of the natural gas price. Potential lower targets are the $2.24 and $2.22 levels.
The post Oil and natural gas: oil loses pace and falls again appeared first on FinanceBrokerage.