USDCAD and USDCNH: USDCAD is on a strong bullish run
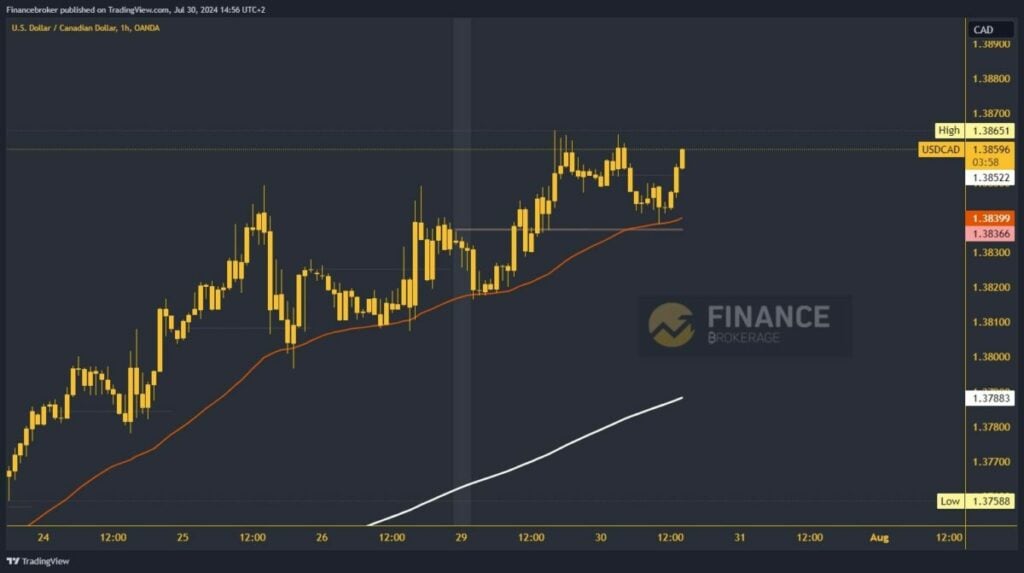
- On Monday, we saw the formation of a new nine-month high for USDCAD at the 1.38651 level.
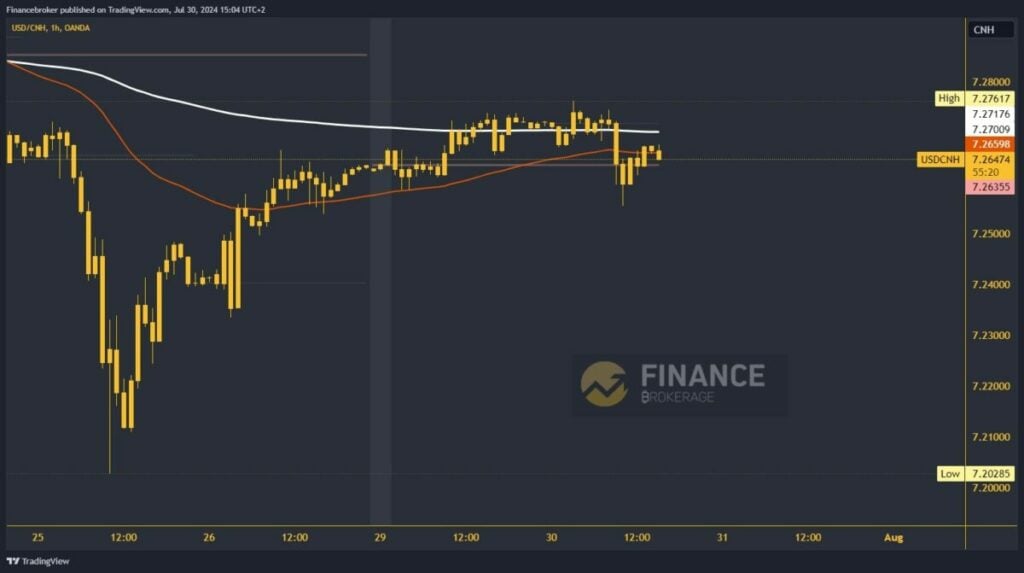
- During this morning’s Asian session, we had short-term USDCNH volatility and a pullback to 7.25556 levels.
USDCAD chart analysis
On Monday, we saw the formation of a new nine-month high for USDCAD at the 1.38651 level. During this morning’s Asian trading session, the pair retreated to the 1.38385 level, testing the weekly open price in that zone. The EMA 50 moving average provides additional support at that level. This led to the initiation of a new bullish consolidation and growth to 1.38595 levels.
We are on the verge of testing the previous high and forming a new one. Potential higher targets are 1.38700 and 1.38800 levels. However, we need to be cautious. A negative consolidation and a pullback of USDCAD again to the weekly open price could signal a bearish option. With momentum below this support, we move to the bearish side. This confirms that the pair does not have the strength for further growth and that a pullback will follow. Potential lower targets are 1.38300 and 1.38200 levels.

USDCNH chart analysis
During this morning’s Asian session, we had short-term USDCNH volatility and a pullback to 7.25556 levels. After receiving support there, the pair started a bullish consolidation up to the 7.26760 level. The recovery seems slow, but we are slowly progressing toward the 7.27000 level and the EMA 200 moving average. We are hoping for an impulse that would move us above and push USDCNH to higher levels.
Potential higher targets are 7.28000 and 7.29000 levels. For a bearish option, we need a negative consolidation and pullback to this morning’s support level. A new visit to that zone would bring pressure to that level and could see a drop below to a new low. Potential lower targets are 7.25000 and 7.24000 levels.

The post USDCAD and USDCNH: USDCAD is on a strong bullish run appeared first on FinanceBrokerage.


