


Exploring S&P 500’s Breakthrough Upwards at 5000.0 Level
- After the consolidation in the first part of this week, we saw a bullish impulse and a jump in the S&P500 index to the 5000.0 level on Wednesday.
- On Wednesday, we saw how the Nasdaq index broke through the previous resistance at the 17700.0 level.
S&P 500 index chart analysis
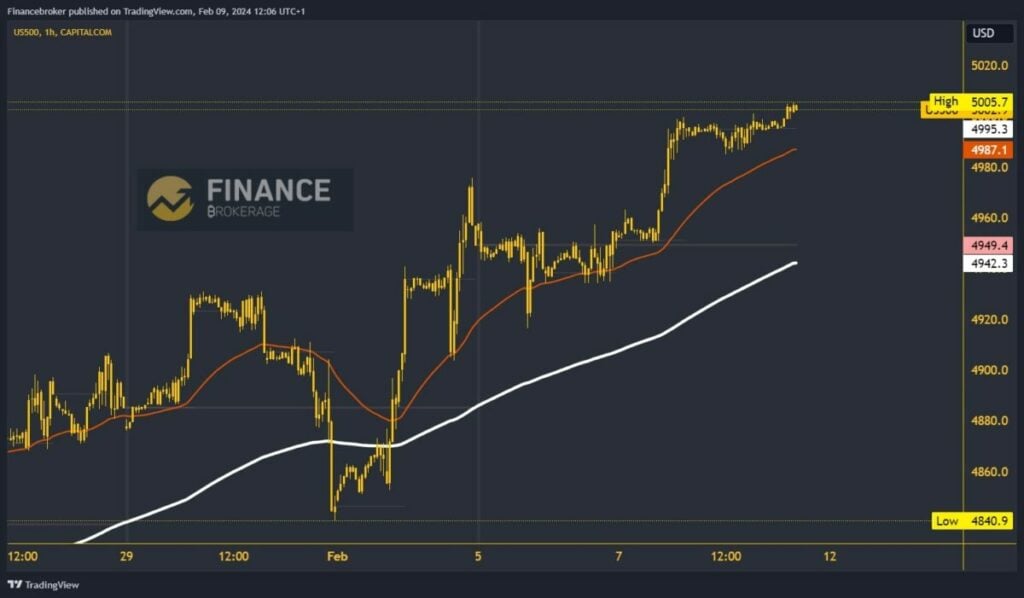
After the consolidation in the first part of this week, we saw a bullish impulse and a jump in the S&P500 index to the 5000.0 level on Wednesday. Thursday was spent consolidating in the 4980.0-5000.0 range.
Today we are looking at a break above and rise to a new historical high at the 5005.7 level. We should not stop there because we are in a bullish trend and expect to see a continuation upwards. Potential higher targets are 5010.0 and 5020.0 levels.
For a bearish option, we need a pullback to the 4980.0 level. With that, we would form a new daily low and break the previous bullish form. There would be an increase in bearish momentum, which would negatively affect the index. Potential lower targets are 4970.0 and 4960.0 levels.
Nasdaq index chart analysis
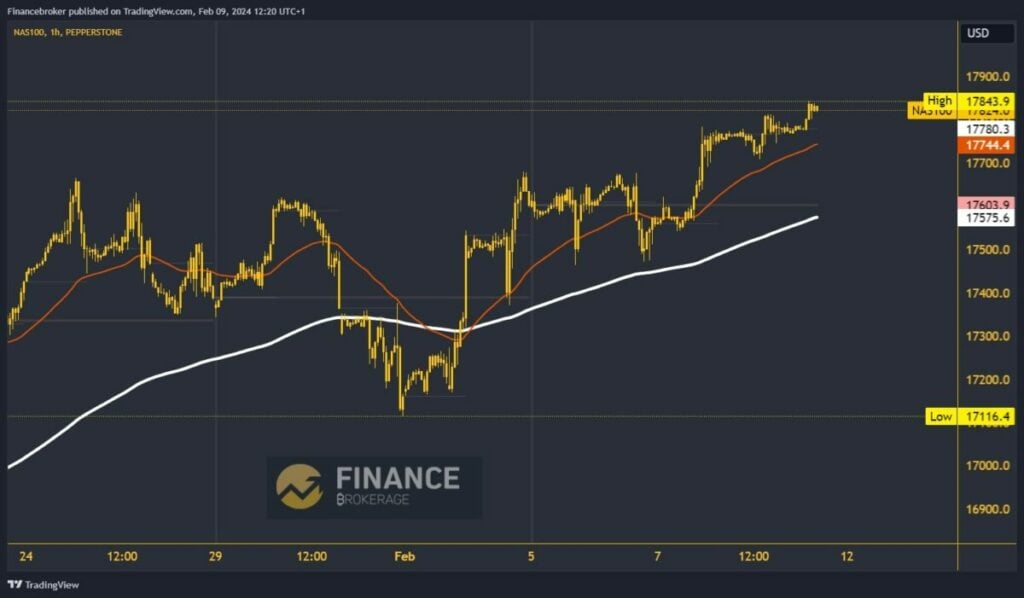
On Wednesday, we saw how the Nasdaq index broke through the previous resistance at the 17700.0 level. Then we see a continuation of the bullish consolidation, and today, we climb to the 17843.9 level, forming a new historical high.
A consolidating dollar index favours the S&P500 and Nasdaq in their growth. There are big chances that we will see both indices at even higher values. Potential higher targets are 17900.0 and 18,000.0 levels.
If we think about the bearish side, we must first see a pullback below the 17700.0 level on the chart. That would be the first sign of weakening of the index. In the zone around 17600.0, we come across the EMA200 moving average, which is our next important trend indicator.
A fall below its line would significantly increase the pressure on the index to start a further pullback. Potential lower targets are 17500.0 and 17400.0 levels.
The post Exploring S&P 500’s Breakthrough Upwards at 5000.0 Level appeared first on FinanceBrokerage.