Yesterday’s stock market selloff was enough to make investors nervous. When Micron Technology (MU) stock fell over 4 percent before the company announced earnings, many were expecting weak earnings. But Micron beat earnings and revenue expectations, and the stock gapped higher at the open by around 8%. This wiped out yesterday’s losses.
Micron’s stock price hit a 52-week high, although it’s come off since then. The stock reached the most active stocks in the S&P 500. It’s worth looking more closely at this stock, especially since it’s in the semiconductor subsector and trading at around $85, making it more accessible than some of the other stocks in the same subsector.
The Weekly View of Micron Technology
Let’s start by looking at the weekly chart of Micron Technology (see chart below).
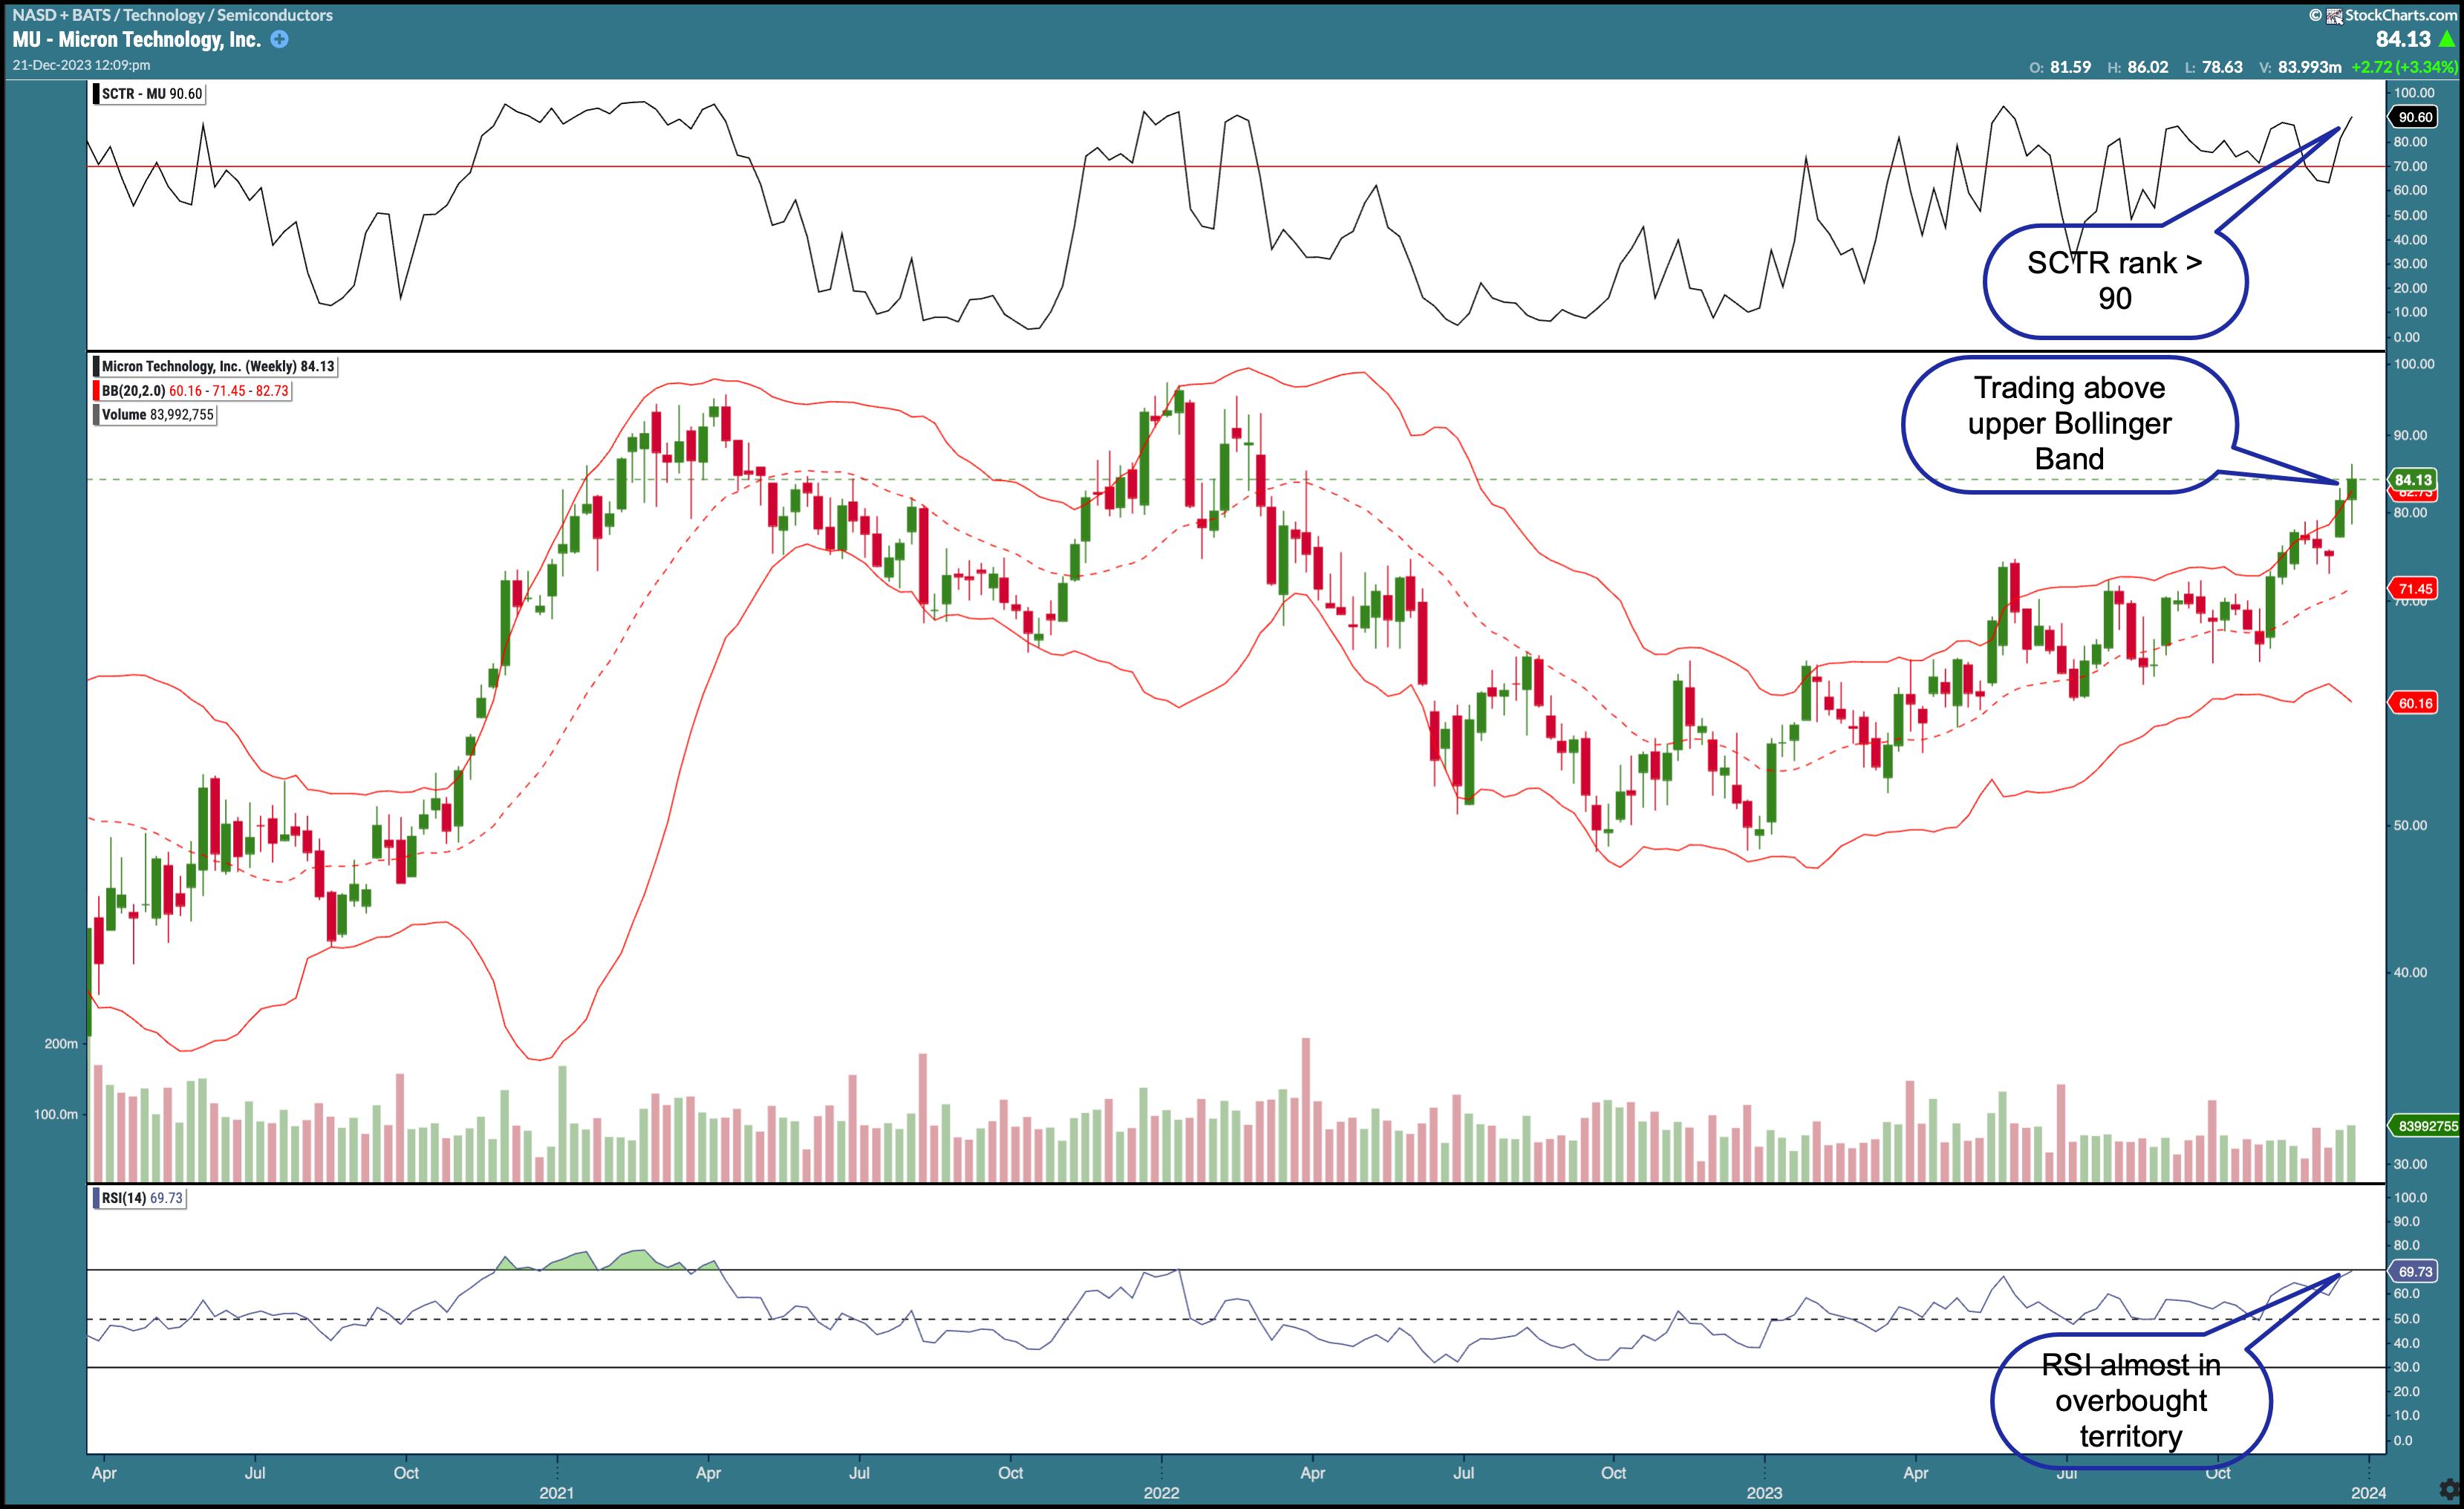
CHART 1: WEEKLY CHART OF MICRON TECHNOLOGY STOCK. The stock broke above its upper Bollinger Band, has a high SCTR score, and the RSI is shy of overbought territory. These indicate the stock has upside potential.Chart source: StockChartsACP. For educational purposes.
MU has moved above its upper Bollinger Band®, its StockCharts Technical Rank (SCTR) score is above 90 and its relative strength index (RSI) is just below overbought territory. All three indicators show this stock has potential to move higher, even in an overextended market.
The Daily View of Micron Technology
Let’s move to the daily chart for MU (below).
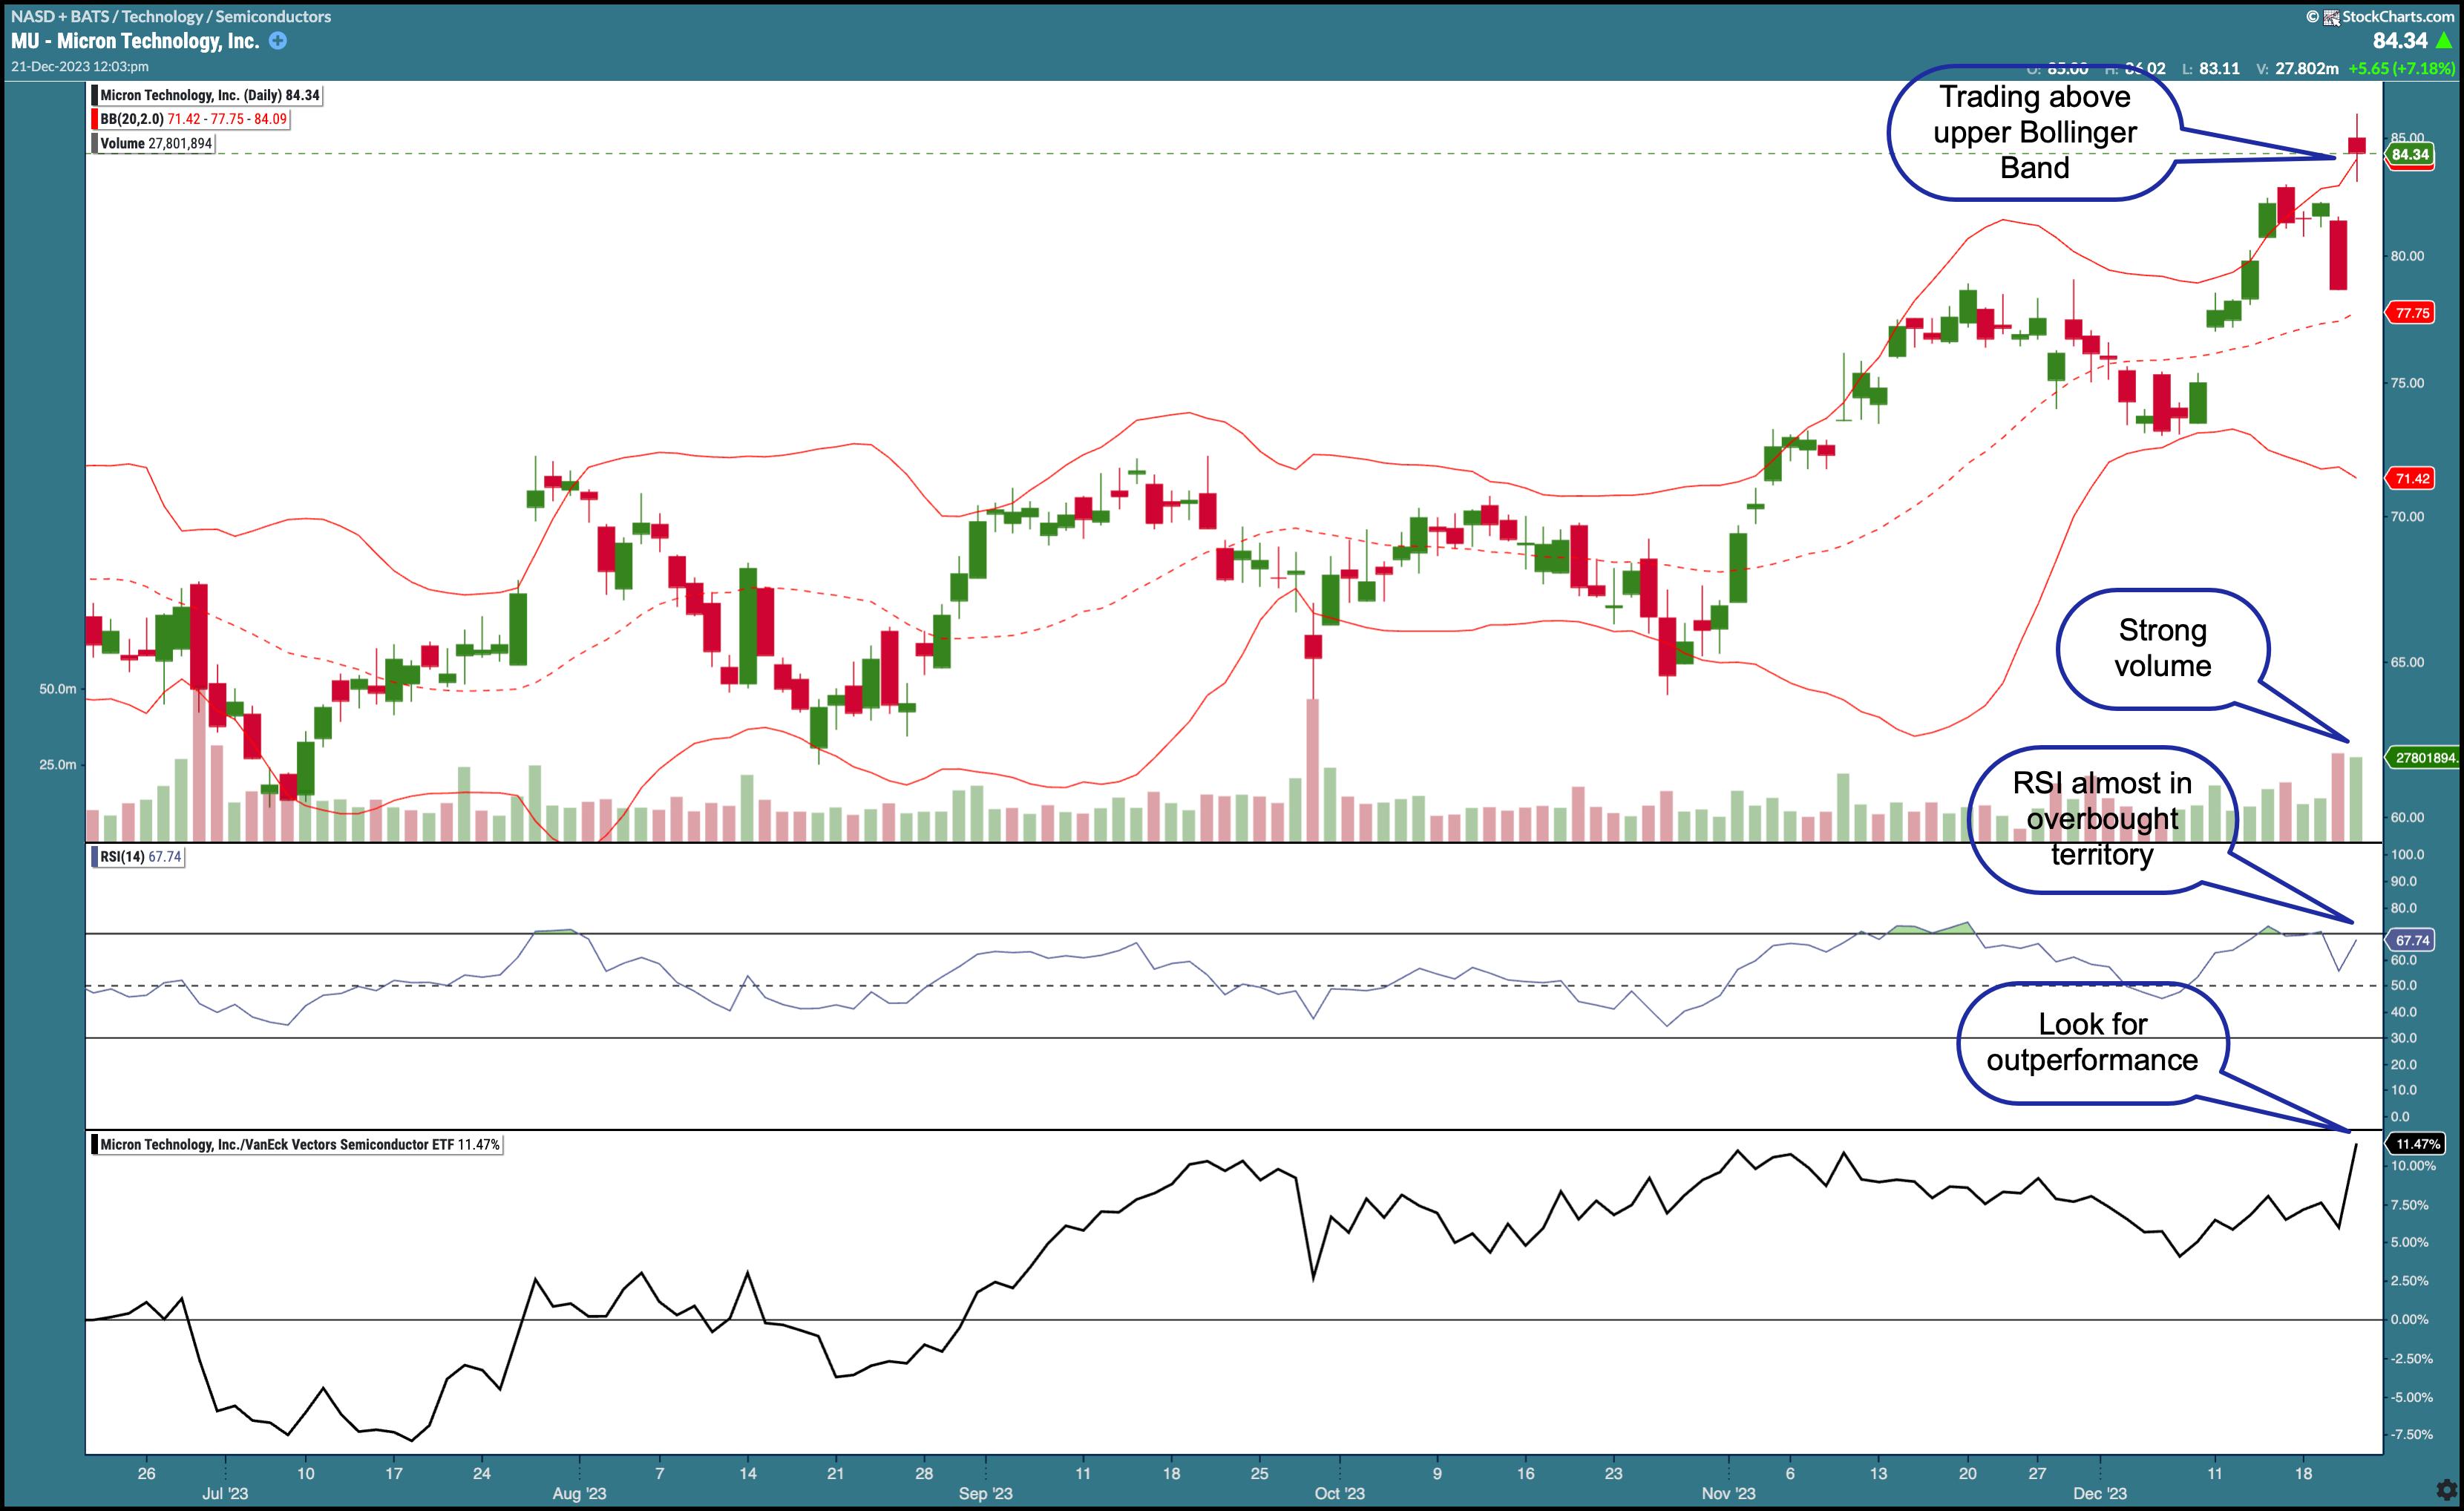
CHART 2: DAILY CHART OF MICRON TECHNOLOGY STOCK. The stock is trading on strong volume, RSI is inching towards overbought territory, and the stock is underperforming the semiconductor industry. If the momentum continues, this stock could move up much higher.Chart source: StockChartsACP. For educational purposes.
The daily chart shows indications similar to the weekly chart. The stock price has hit a 52-week high, it’s trading above its upper Bollinger Band, volume is above average, the RSI is below overbought territory, and MU is underperforming the VanEck Vectors Semiconductor ETF (unadjusted data) but trending higher.
The Bottom Line
When a stock moves above the upper Bollinger Band, it signifies strength. If you were to enter the trade now, as long as price walks the upper band, you’d stay in the trade. The 20-day simple moving average (dashed red line) can be your first support level. You could also wait for the next pullback before entering the trade.
Fundamentally, between now and the next earnings report, the stock looks positive. Guidance from Micron’s earnings report on Wednesday after the close was strong mainly because as AI becomes more mainstream, demand for memory chips is likely to increase. So, if you missed the boat on some of the Magnificent Seven stocks, MU may present an opportunity to jump in on the AI rally. This stock has room to run.

Disclaimer: This blog is for educational purposes only and should not be construed as financial advice. The ideas and strategies should never be used without first assessing your own personal and financial situation, or without consulting a financial professional.


